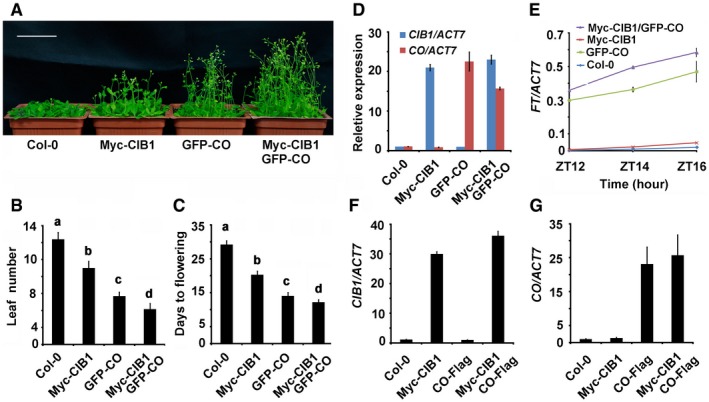
Figure EV4. CIB1 and CO act together to promote FT transcription.

-
A28‐day‐old of the genotypes indicated grown in LDs. Scale bar: 5 cm.
-
B, CThe time to flowering and the number of rosette leaves at the time of flowering of the genotypes indicated. SDs (n > 15) are indicated. The letters “a” to “d” indicate statistically significant differences between leaf numbers of the indicated genotypes, as determined by Tukey's HSD test (P ≤ 0.01).
-
DqPCR results showing mRNA expression of CIB1 and CO in the genotypes indicated. The transcript levels of CIB1 or CO in Col are set to 1.0. Samples were collected from 7‐day‐old seedlings of the genotypes indicated at ZT16. Error bars represent SD of three technical replicates.
-
EqPCR results showing mRNA expression of FT in the genotypes indicated. Samples were collected from 7‐day‐old seedlings of the genotypes indicated at ZT12, ZT14, and ZT16. Error bars represent standard deviation of three technical replicates.
-
F, GqPCR results showing mRNA expression of CIB1 and CO in the genotypes indicated. The transcript levels of CIB1 or CO in Col are set to 1.0. Samples were collected from 7‐day‐old seedlings of the genotypes indicated at ZT16. Error bars represent SE of three biological replicates.
