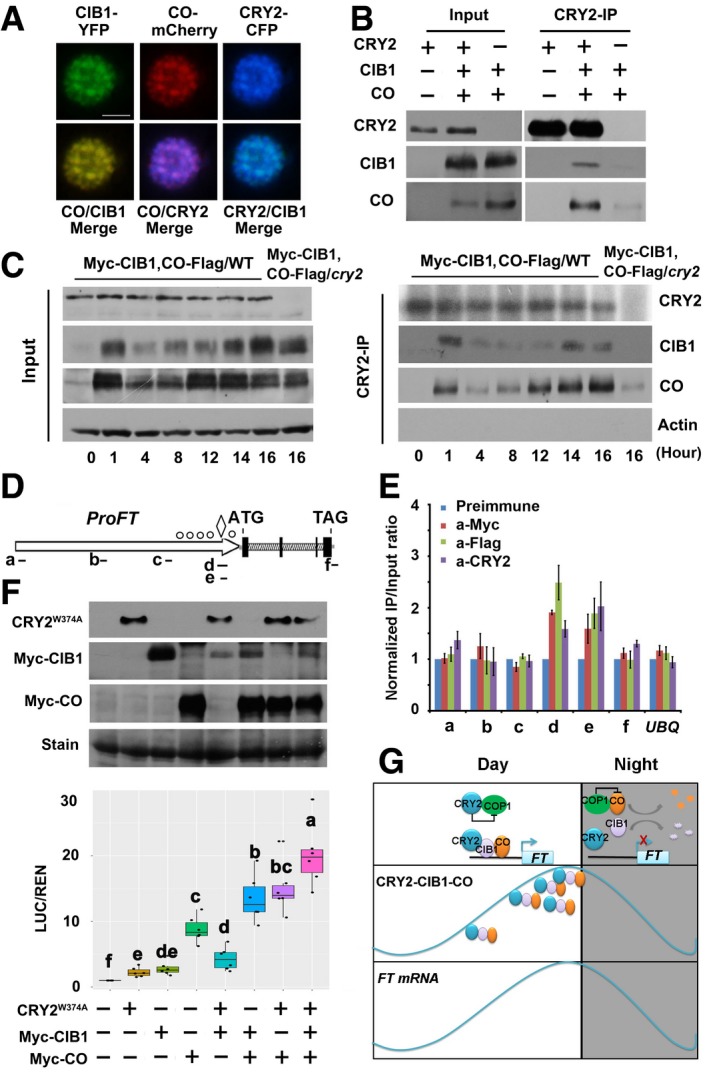
Fluorescent microscopy images showing that CRY2, CIB1, and CO co‐localized to the nucleus. Scale bars: 2 μm.
Co‐IP assays showing that CRY2, CIB1, and CO form a protein complex. Samples were prepared from 10‐day‐old WT or 35S:Myc‐CIB1/35S:CO‐Flag or 35S:Myc‐CIB1/35S:CO‐Flag/cry2‐1 seedlings grown in LDs (16L/8D), and samples were collected at ZT16.
Co‐IP assays of samples prepared from 10‐day‐old 35S:Myc‐CIB1/35S:CO‐Flag 35S:Myc‐CIB1/35S:CO‐Flag/cry2‐1 seedlings grown in LDs (16L/8D). Samples were collected at the times indicated over the course of 1 day.
Diagram depicting the putative promoter and genomic region of FT. The diamond symbol indicates the position of CORE. The white circles indicate positions of E‐boxes (CANNTG) located at proximal promoter of FT.
Representative results of the ChIP‐qPCR assays. Chromatin fragments (˜500 bp) were prepared from 10‐day‐old 35S:Myc‐CIB1/35S:CO‐Flag seedlings, immunoprecipitated by the anti‐CRY2, anti‐Flag (CO‐Flag), anti‐Myc (Myc‐CIB1) antibody, or anti‐preimmune IgG, and the precipitated DNA was analyzed by qPCR using the primer pairs indicated. The IP/input ratio of anti‐preimmune is set to 1.0.
Box plots (the minimum, first quartile, median, third quartile, and maximum are shown, with data > 1.5 interquartile ranges denoted with circles) for relative reporter activity (LUC/REN) in plants expressing different reporters and effectors. The LUC/REN in plants expressing ProFT alone is set to 1.0. Immunoblots were done to show GFP‐CRY2W374A, Myc‐CIB1, and Myc‐CO protein levels in the transient Dual‐LUC assay. Samples were separated on 10% SDS–PAGE, blotted, probed with the anti‐Myc antibody and with the anti‐GFP antibody.
Model representing the action of CIB1 and CO on FT expression under long‐day condition.
Data information: For data in (E), the relative IP/input ratios are shown with their standard deviation (
= 3). Two biological replicates were performed. For data in (F), the relative LUC activities normalized to the REN activity are shown (LUC/REN) as boxplots. The letters “a” to “f” indicate statistically significant differences determined by Tukey's HSD test (
≤ 0.05). Two biological replicates were performed.

