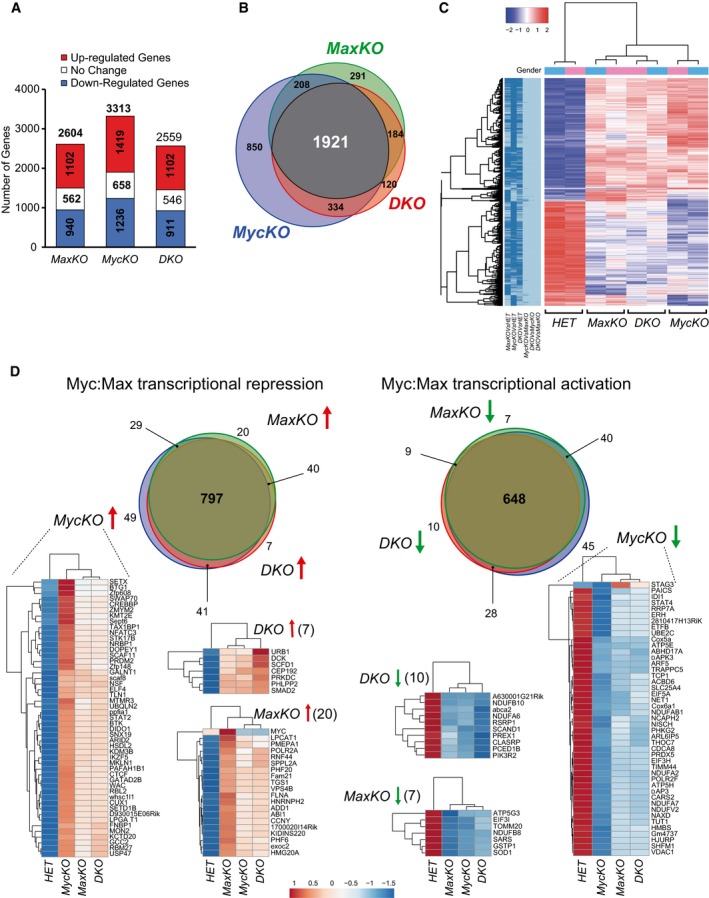
Bar plot showing the number of DEGs (adj. P‐value < 0.01, FC +1.5 in red, 1.5 < FC > −1.5 in white, FC < −1.5 in blue). Sorted B220+
GFP
+ spleen B cells from MaxKO‐cd19, MycKO‐cd19, DKO‐cd19, and control HET‐cd19 mice were activated with LPS plus IL‐4 for 72 h and analyzed. Two samples for each condition were used.
Venn diagrams showing the number of common DEGs in all conditions.
Hierarchical clustering heatmap of DEGs in any comparison (two samples per condition). Dark blue in left panel indicates significance for that contrast column. Color code: Red represents upregulation; white, unchanged; and blue, downregulation of expression. Gender: color code for genetic condition. Pink are female and blue color male mice. Colour key (−2 to 2): raw Z‐score.
Venn diagrams of up‐ (left) and downregulated genes (right) for all three conditions (±1.5‐FC and P < 0.01). Heatmaps of genes only deregulated in MaxKO‐cd19, MycKO‐cd19, or DKO‐cd19 mice are shown. Color code is the same as (C).

