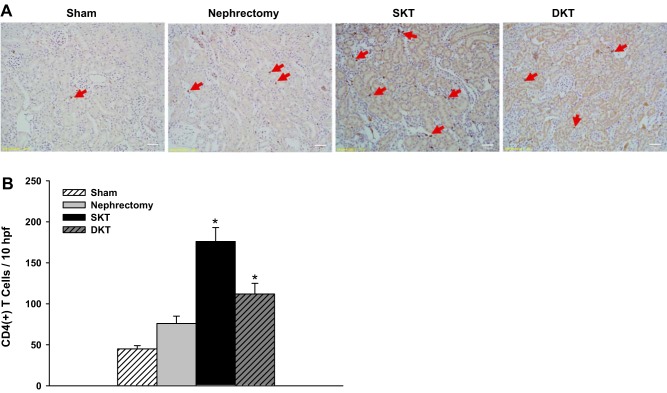
Fig. 6.
Immunohistochemistry analysis. A: immunohistochemical staining of CD4. Red arrow indicates the positive cells. B: average number of CD4+ T cells per 10 fields was analyzed.(*P < 0.01 vs. other groups; n = 6). DKT, dual-kidney transplantation; hpf, high power field; SKT, single-kidney transplantation.

