
Fig. 1.
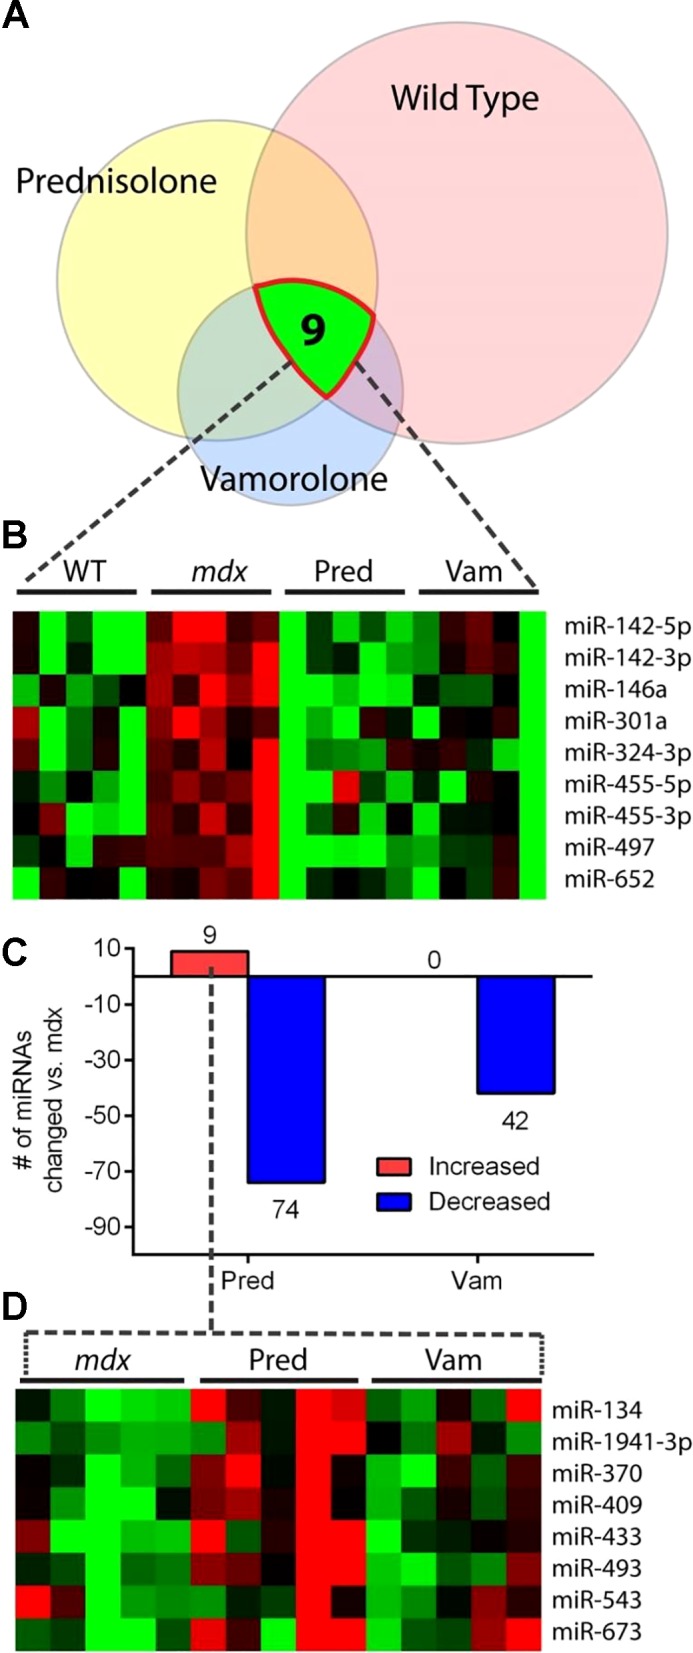
Summary of muscle miRNA changes discovered in response to dystrophy and its treatment. Expression of the miRNAome was quantified in diaphragm muscle of mice from a discovery set of mice (n = 5 mice per group). Groups included WT (vehicle), mdx (vehicle), mdx treated with prednisolone (5 mg/kg), and mdx treated with vamorolone (15 mg/kg), with mice treated from 2 to 8 wk of age in a prophylactic trial design. A: a Venn diagram illustrates the proportion of miRNAs that are significantly different than untreated mdx muscle in the WT, prednisolone, and vamorolone groups. The nine miRNAs that were significantly different in all three groups vs. untreated mdx, highlighted here, were chosen as a focus set of efficacy-associated miRNAs. B: heat map visualization of the expression of the nine efficacy associated miRNA markers within each individual mouse. C: bar graph showing the number of miRNAs that significantly increased or decreased in response to either of the drug treatments. D: heat map of the eight unique miRNAs that were increased by prednisolone. Heat map: red, increased; green, decreased. Pred, prednisolone; Vam, vamorolone; WT, wild type.