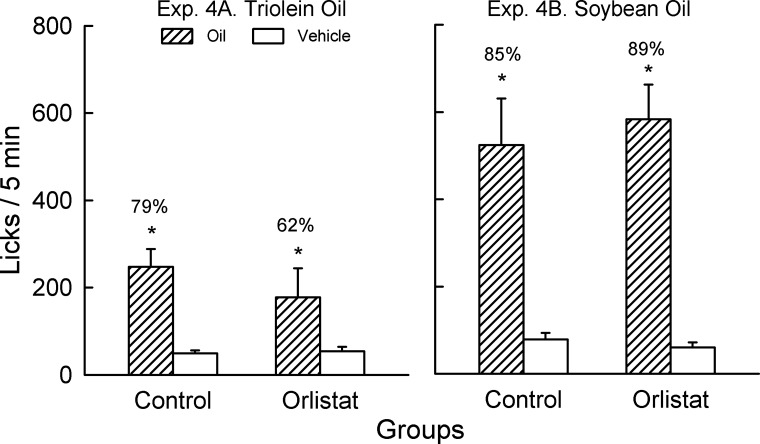
Fig. 5.
Experiment 4. Licks (means ± SE) for 2% oil vs. gum vehicle in control and orlistat groups (n = 10 each) during 5-min, 2-bottle tests. Left: experiment 4A: 2% triolein oil. Right: experiment 4B: 2% soybean oil. Orlistat (0.5%, 250 mg/g of fat) was added to the oil and vehicle in the orlistat group. Number above bar represents mean percent preference for oil. *Significant differences (P < 0.05) between oil vs. vehicle licks within each test.

