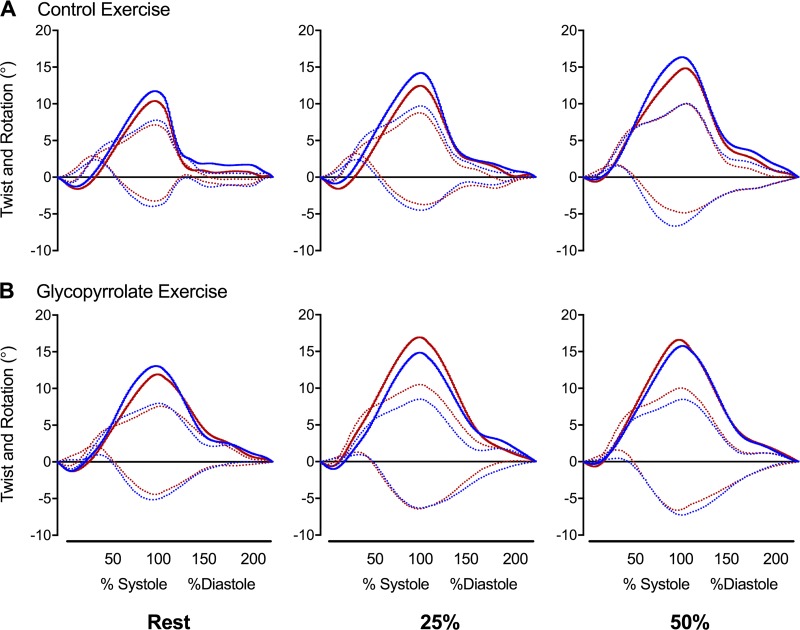
Fig. 2.
Left ventricular twist mechanics at rest (left), 25% (middle), and 50% (right) of peak power during exercise in control (A) and glycopyrrolate (B) experiments. Blue and red lines represent mean data for men and women, respectively. Solid lines represent left ventricular twist, and dotted lines represent rotation (base: negative and apex; positive). SD, n, and statistical analyses for peak data are shownin Table 5. *P < 0.05, men vs. women.

