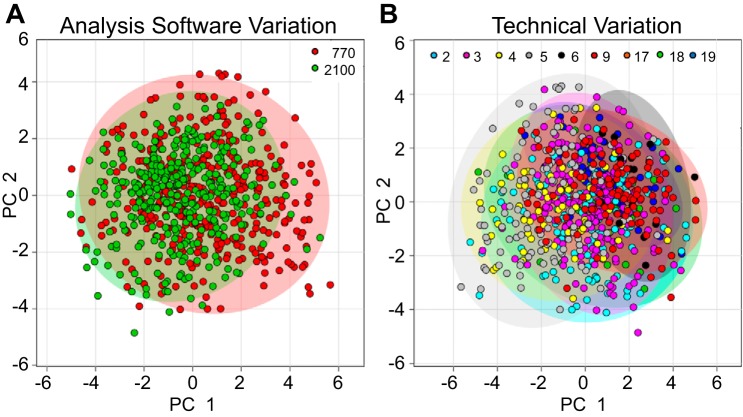
Fig. 3.
Principal component analysis of echocardiography data showed low analysis software or technical variation. A: we tested technical variation using VisualSonics Vevo 770 vs. Vevo 2100. B: laboratory members were assigned a unique identifying number (colored numbers at the top of each image) to assess interperson variation. Principal component analysis showed low variation between analysis software and reader, as indicated by the 95% confidence ellipses around the clusters.

