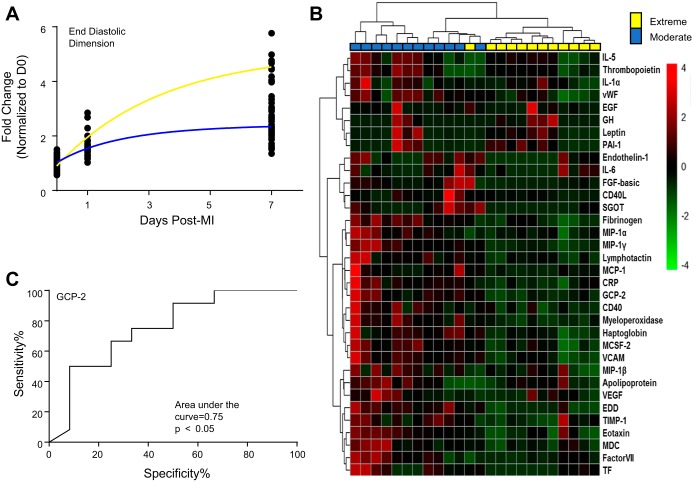
Fig. 6.
An example that demonstrates the use of the Mouse Heart Attack Research Tool (mHART). A: by querying the mHART database, we identified two distinct left ventricle (LV) dilation response groups, based on their end-diastolic dimensions. Blue line, moderate response; yellow line, extreme response. B: analysis of 52 plasma proteins identified potential drivers that correlate with dilation outcome. n = 12 mice/group. C: receiver operating characteristic (ROC) analysis of the 34 analytes identified granulocyte chemotactic protein (GCP)-2 as having the largest area under the curve for increased dilation. D0, day 0; MI, myocardial infarction.

