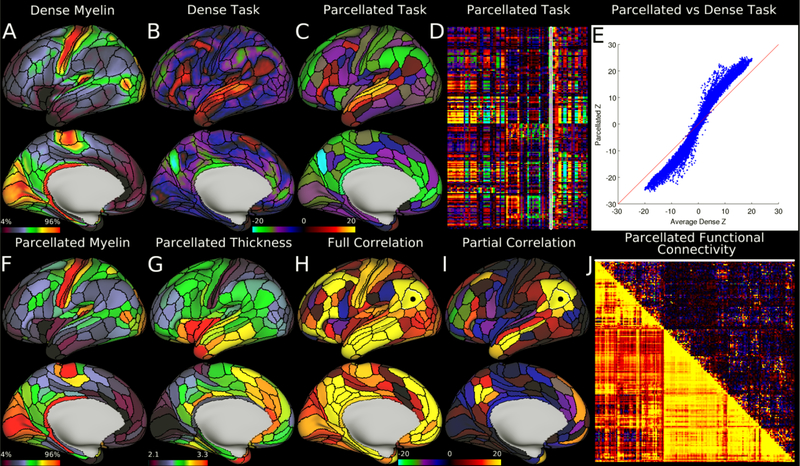
Figure 4.
Example parcellated analyses run using HCP data and the HCP_MMP1.0 cortical parcellation. Panels A and F, showing dense and parcellated myelin maps respectively, are very similar despite a dramatic dimensionality reduction. Panel G shows a map of parcellated cortical thickness (in millimeters; corrected for folding by regressing out mean surface curvature). Panels B and C show example dense and parcellated task fMRI analysis (LANGUAGE Story vs Baseline). Panel D shows the entire HCP task fMRI battery’s Z statistics (86 contrasts; 47 distinct and 39 sign-reversed versions) analyzed in parcellated form and displayed as a matrix (rows are parcels, columns are contrasts, white outline indicates the map displayed in Panel C). Panel E demonstrates a major improvement in Z statistics from fitting a task design on parcellated data instead of fitting it on dense data, and then parcellating afterwards. Panels H and I show parcellated functional connectivity maps on the brain (seeded from area PGi, black dot). In both cases, the task negative (default mode) network is apparent. Panel J shows a parcellated connectome matrix view with the full correlation connectome below the diagonal and the partial correlation connectome above the diagonal (white line shows the displayed partial correlation brain map). The figure matches the Connectome Workbench scene available on the BALSA database (http://balsa.wustl.edu/RG0x). Notably, Panel E was generated in matlab and saved as a PNG and then loaded in to Workbench as its own tab. Reprinted from ref8.

