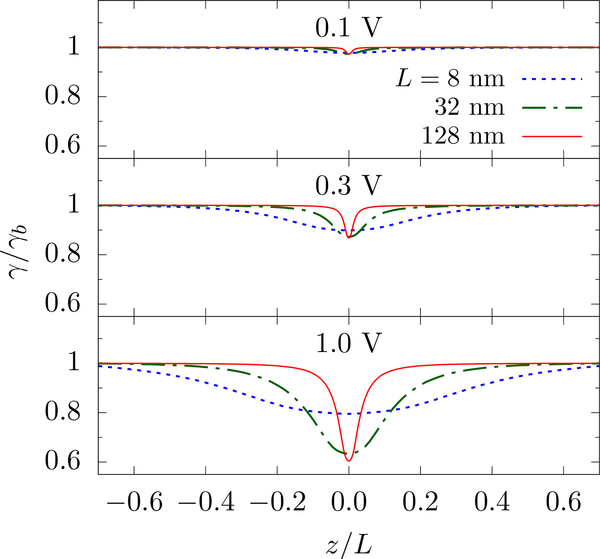
FIG. 7.
The resistivity along the z-axis for various applied potentials and cell dimensions L. The pore radius is a = 1 nm and the KCl concentration is 0.1 mol/L (γb = 710 MΩ·nm). Large applied voltages enhance the density of charge carriers near the pore, decreasing the resistivity. Since the access resistance contribution is largest near the pore, see Eq. 5, this enhancement lowers the overall access resistance and gives an apparent depression to the golden aspect ratio when examining small simulation cells.

