
Fig. 3.
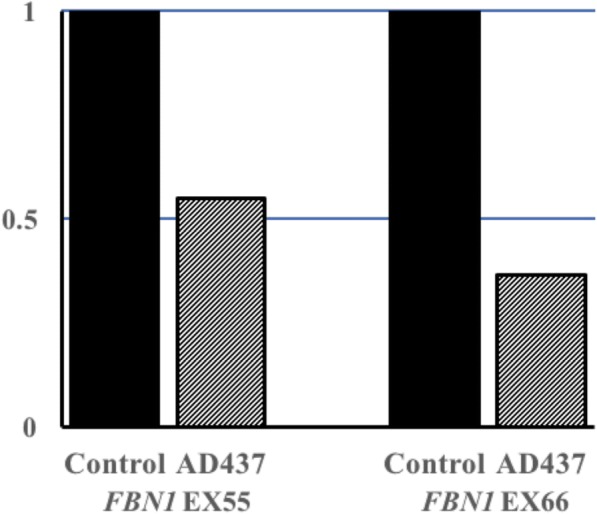
Verification of gross deletions in AD437 by quantitative PCR. The bar graph shows the relative ratio of DNA from AD437, indicating the presence of a heterozygous deletion in the region
Official websites use .gov
A
.gov website belongs to an official
government organization in the United States.
Secure .gov websites use HTTPS
A lock (
) or https:// means you've safely
connected to the .gov website. Share sensitive
information only on official, secure websites.
Verification of gross deletions in AD437 by quantitative PCR. The bar graph shows the relative ratio of DNA from AD437, indicating the presence of a heterozygous deletion in the region