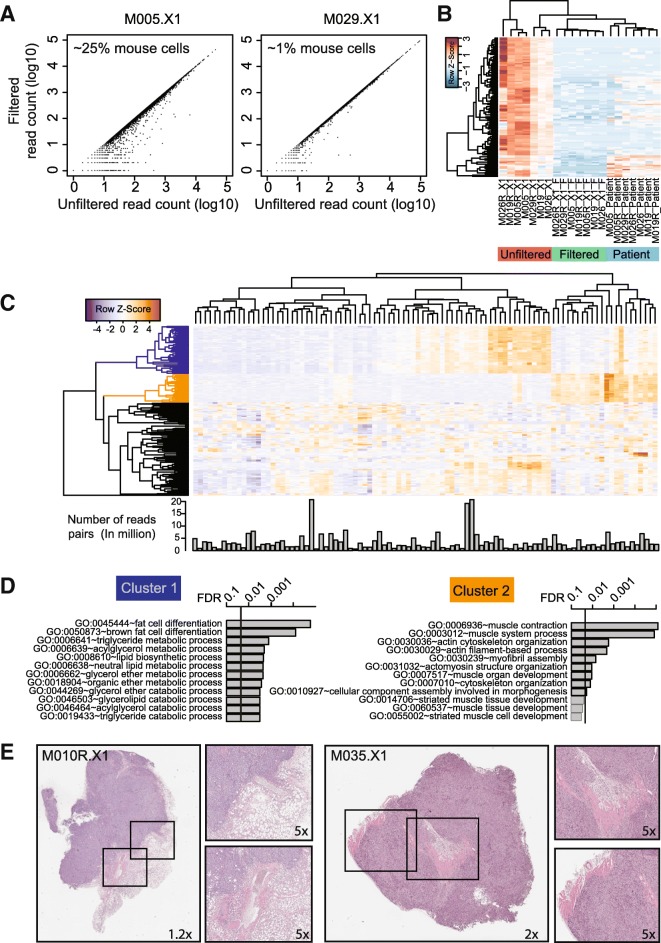
Fig. 6.
XenofilteR on RNAseq data. a. Scatter plots showing the number of RNA sequence reads before and after filtering for mouse sequence reads with XenofilteR both for a sample with a high percentage of mouse stromal cells (M005.X1) and a sample with a low percentage of mouse stromal cells (M029.X1). b. Cluster analysis of PDX samples before and after XenofilteR with matched patient samples. c. Heat map of the top 250 most variable mouse genes retrieved from a dataset of 95 PDX samples. Bar graph below the heat map shows the number of mouse sequence reads. d. Gene Ontology (GO) analysis of the top 2 clusters from c. e. H&E staining of a PDX sample with adjacent mouse fat cells (left) and a PDX sample with mouse muscle cells (right)

