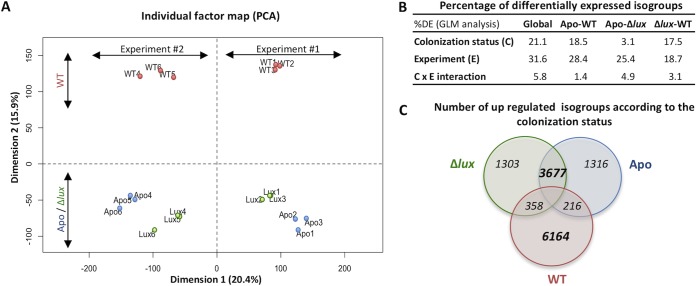
FIG 3.
Influence of colonization status and experimental replication on gene expression patterns. (A) Principal-component analysis (PCA) results generated with the variance-stabilized data of the 53,719 filtered isogroups. (B) Percentage of differentially expressed (DE) isogroups after a generalized linear model (GLM) analysis on the whole data set or on subsets containing Apo and WT-colonized, Apo and Δlux mutant-colonized, or WT-colonized and Δlux mutant-colonized squid. We tested whether normalized count data depended on colonization status and experimental replication, and whether there was any interaction between these two factors. (C) Venn diagram of isogroups that were overrepresented after the GLM analyses presented in panel B. In particular, 3,677 isogroups (i.e., 68.9% of the isogroups overexpressed in Apo and 70.6% of those overexpressed in Δlux mutant-colonized light organs) are overexpressed in Apo light organs compared to WT-colonized light organs and overexpressed in Δlux mutant-colonized light organs compared to WT-colonized light organs. In contrast, 6,164 isogroups (i.e., 90.3% of the isogroups overexpressed in WT-colonized light organs) are specifically overexpressed in WT-colonized light organs compared to Apo or Δlux mutant-colonized light organs; i.e., they are not overexpressed in Apo light organs compared to Δlux mutant-colonized light organs or in Δlux mutant-colonized light organs compared to Apo light organs.

