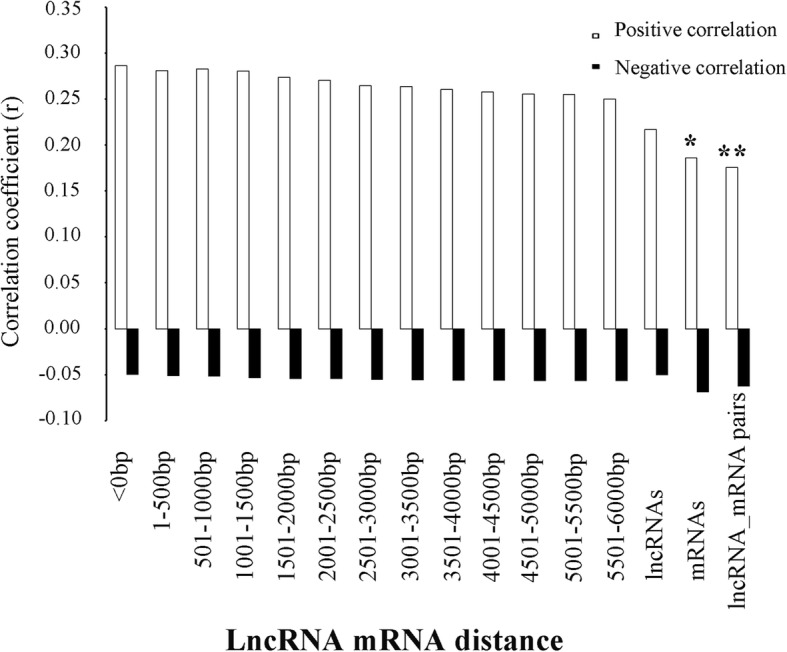
Fig. 2.

The relationship between positive and negative correlation coefficients (r_mean) and lncRNA-mRNA distances. The positive and negative r_mean for all lncRNAs, mRNAs and lncRNA-mRNA pairs were plotted. ‘*’ and ‘**’, indicate significant differences (p < 0.05 or p < 0.001) of positive r_mean values compared to the r_mean of overlapped lncRNA-mRNA pairs as assessed using the Fisher r-to-z transformation statistics
