Figure 1.

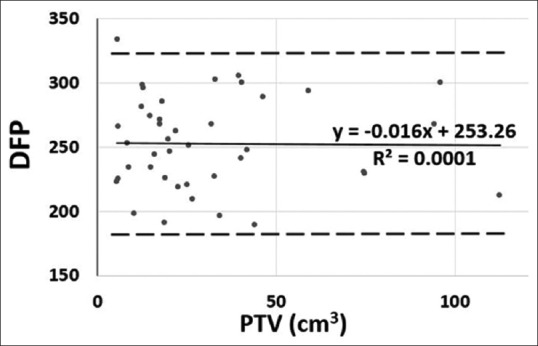
Plot showing the values of dose falloff product with the volume of PTV. The solid line represents trend line represented by the equation while dashed lines shows twice standard deviation

Plot showing the values of dose falloff product with the volume of PTV. The solid line represents trend line represented by the equation while dashed lines shows twice standard deviation