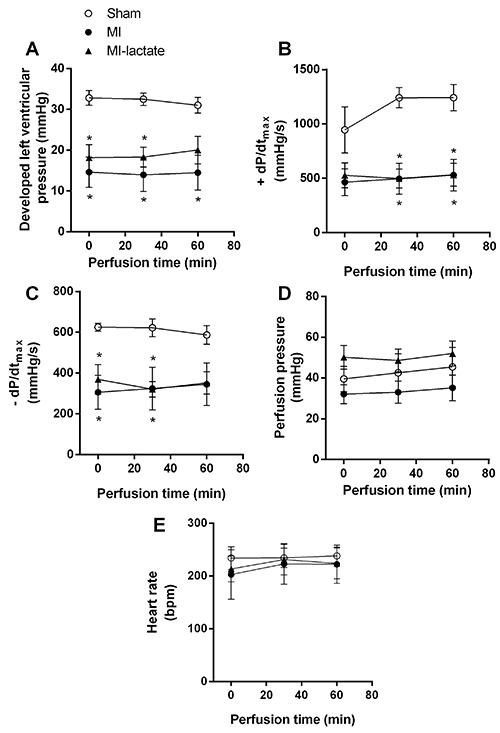
Figure 1. A, Left ventricular developed pressure, B, maximum positive (+dP/dtmax and C, negative (-dP/dtmax), D, perfusion pressure, and E, heart rate after 60 min of perfusion with Krebs-Henseleit or KH plus lactate. MI: myocardial infarction. Data are reported as means±SE of 6 hearts. *P<0.05 compared to Sham group (ANOVA).

