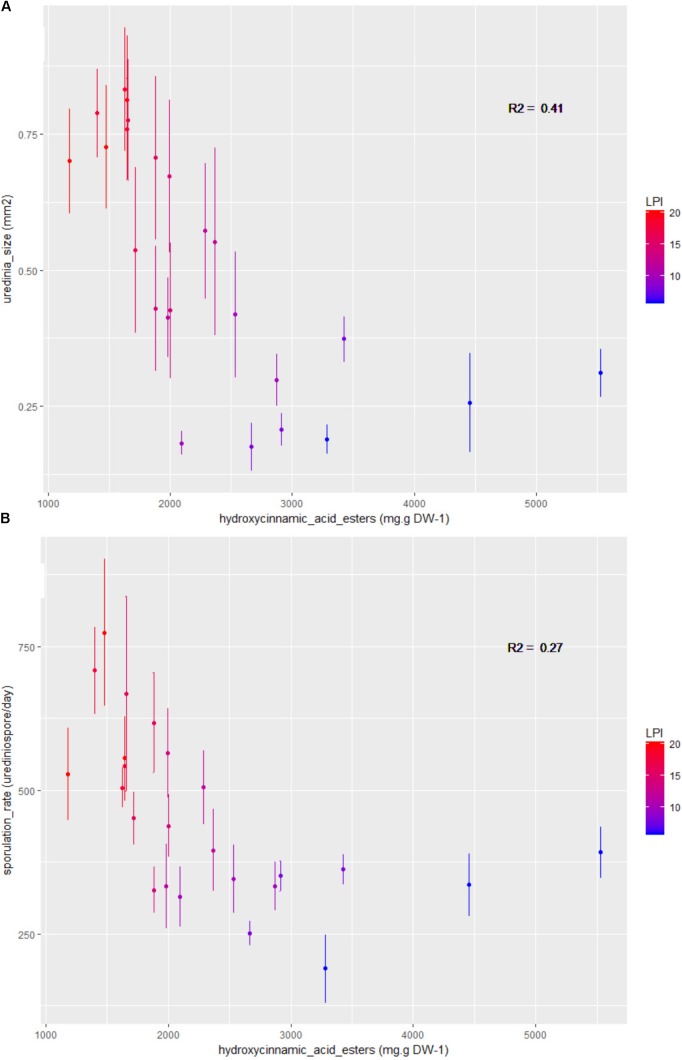
FIGURE 5.
Bivariate plots (LPI and plant mean ± standard error calculated on three plants and 15 to 24 replicates per LPI) showing the variation in (A) uredinia size and (B) sporulation rate according to the phenolic subclass hydroxycinnamic acid esters content. Colors stand for LPI and R2 gives the coefficients of determination.

