Fig. 3.
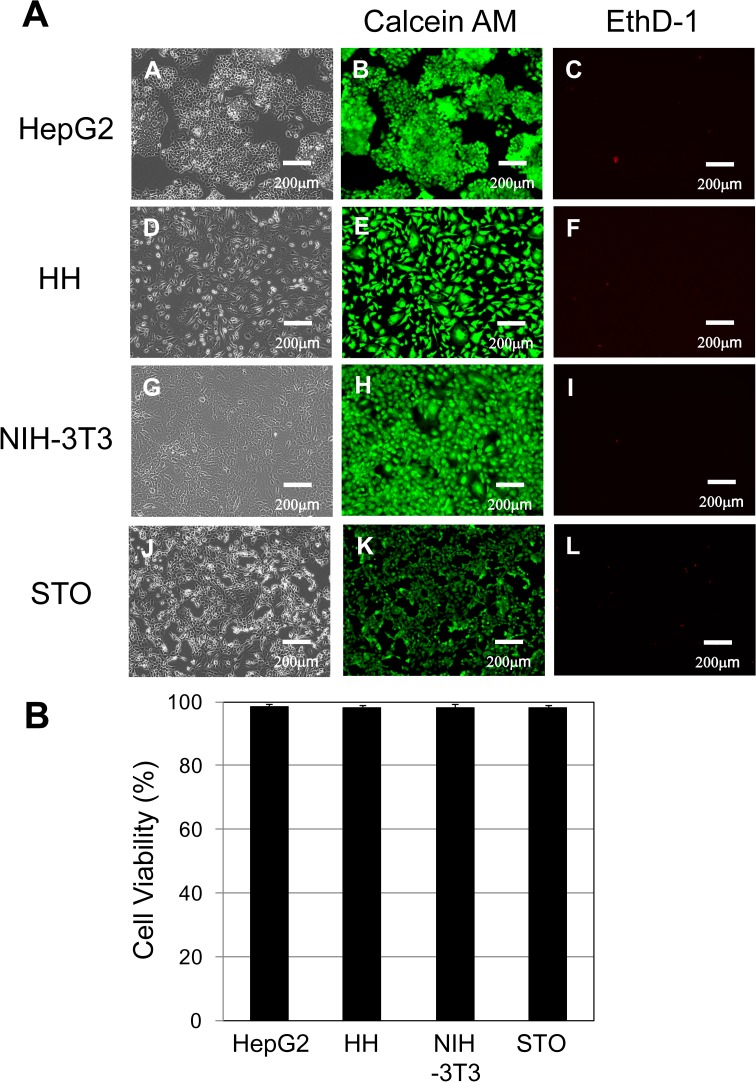
Cell viability of living/dead cells in the human and mammalian cells. (A) HepG2, HH, NIH-3T3, and STO cells at a density of 2 × 10⁵ cells were inoculated onto 60-mm dishes for 4 d (phase contrast; A, D, G, and J). HepG2, HH, NIH-3T3, and STO cells were stained with calcein acetoxymethyl ester (calcein AM) and ethidium homodimer-1 (EthD-1) to visualize living and dead cells. Calcein AM-positive green fluorescence (B, E, H, and K) in living cells and EthD-1-positive red fluorescence (C, F, I, and L) in dead cells were observed with a fluorescence microscope. Scale bar: 200 μm. (B) Cell viability of human and mammalian cells attached onto 60-mm dishes. HepG2: HepG2 cells; HH: HH cells; NIH-3T3: NIH-3T3 cells; STO: STO cells. The cell storage settings were as follows: −80 °C (black column). The data represent the means and SD of three independent experiments.

