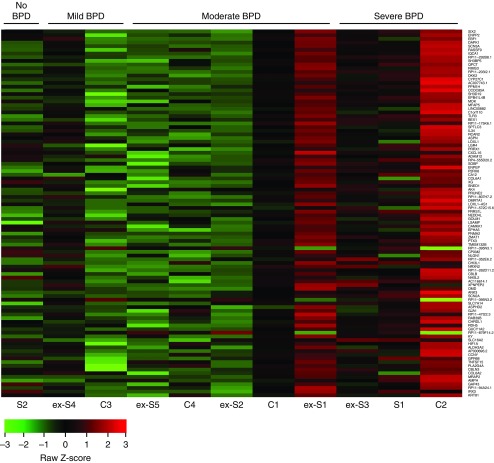
Figure 2.
Heat map depicting relative bronchopulmonary dysplasia (BPD) module member gene expression for individual mesenchymal stromal cell lines. Genes are ranked by intramodular connectivity (top 100 of 286 are shown here, with highest at the top). The BPD module correlates with BPD, and thus lines chosen for this analysis were all mesenchymal stromal cells from patients born at gestational age less than 32 weeks. C = canalicular; ex-S = extrauterine saccular; S = saccular.

