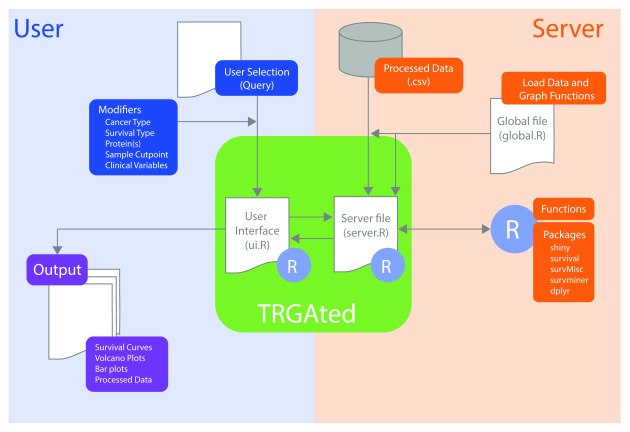
Figure 1. Diagram of the implementation of TRGAted.
Each file communicates within the R Shiny framework. On the user side (left, blue), users select pertinent cancer type, protein of interest, and clinical variables into the CSS-enabled user interface. This information is received by the server file enabling the subsequent run in R. On the server side (right, orange), the specific cancer type from the database, R packages, and functions are retrieved and executed. After execution, the server file provides both tabular and graphical output (purple) to the user interface and is displayed.

