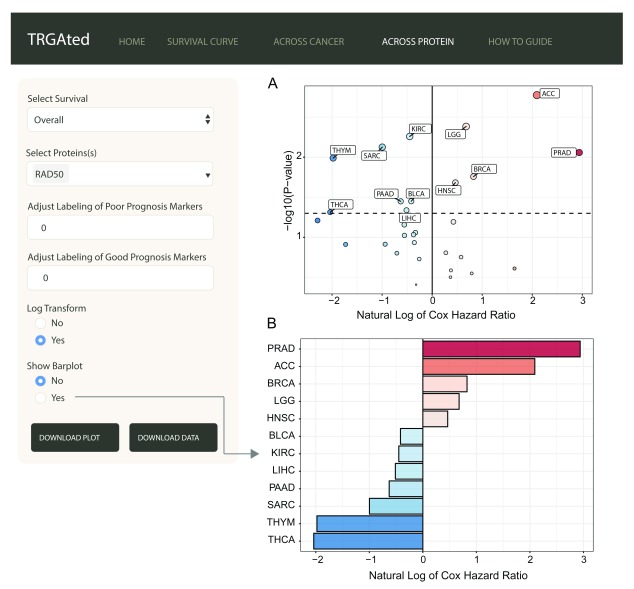
Figure 4. Visualizing all proteins across a single cancer type.
The interface shows an example of the visualization of Cox hazard ratio of for RAD50 across all 31 cancer types ( A). This feature is similar to the Across Cancer tab with the ability to adjust labels and log-transform the Cox hazard ratios. Additionally, the hazard ratios for significant cancer types can be visualized using a bar chart ( B).

