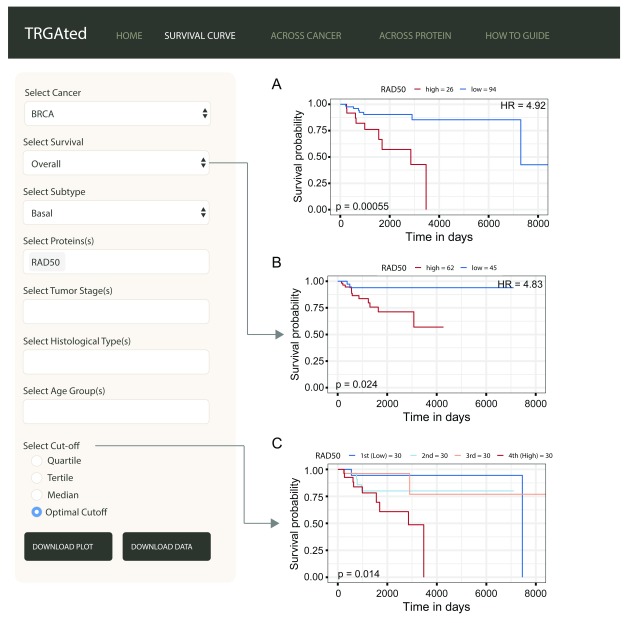
Figure 2. Generating survival curves.
The interface shows an example of an overall survival curve for the RAD50 protein in the basal subtype of breast cancer using the optimal cutpoint ( A). Disease-specific survival, disease-free interval, and progression-free interval can also be selected ( B). The cutpoint can be varied to separate samples based on protein level into quartiles, tertiles, medians or separating into two groups based on the lowest p-value ( C).

