. 2017 Aug 20;42(3):97–104. doi: 10.1584/jpestics.D17-006

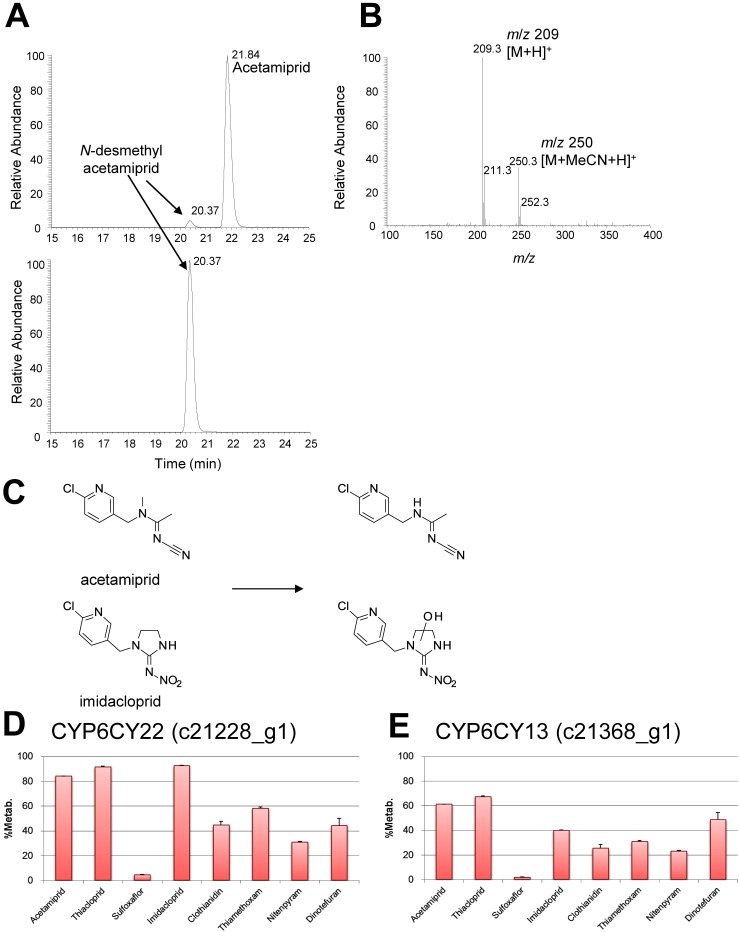
Fig. 3. ESI-LC-MS spectra of acetamiprid and imidacloprid, structures of the metabolites, and percentages of metabolites. (A) LC elution profile of acetamiprid in extracts of D. melanogaster S2 cells expressing the c21228_g1 gene (12 hr after test compound was added). (B) LC-MS spectrum of acetamiprid in an extract of D. melanogaster S2 cells expressing the c21368_g1 gene. (C) Structures of the metabolites of acetamiprid and imidacloprid. (D) Metabolism of test compounds in cultures of cells expressing the c21228_g1 gene. (E) Metabolism of test compounds in cultures of cells expressing the c21368_g1 gene. Data are the mean±SD (n=3).

Fig. 3. ESI-LC-MS spectra of acetamiprid and imidacloprid, structures of the metabolites, and percentages of metabolites. (A) LC elution profile of acetamiprid in extracts of D. melanogaster S2 cells expressing the c21228_g1 gene (12 hr after test compound was added). (B) LC-MS spectrum of acetamiprid in an extract of D. melanogaster S2 cells expressing the c21368_g1 gene. (C) Structures of the metabolites of acetamiprid and imidacloprid. (D) Metabolism of test compounds in cultures of cells expressing the c21228_g1 gene. (E) Metabolism of test compounds in cultures of cells expressing the c21368_g1 gene. Data are the mean±SD (n=3).