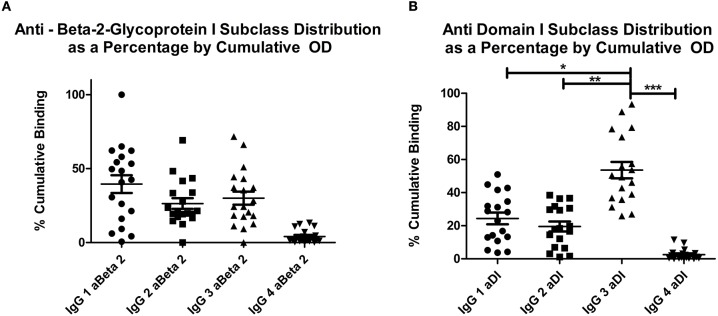
Figure 1.
(A) shows the distribution of OD as a percentage of cumulative OD for aβ2GPI antibodies, (B) shows the same measure for aDI antibodies. The increase in IgG3 percentage can be seen in (B), this was significantly higher than any other subclass. Both panels show IgG4 significantly lower than any other subclass for both antigens. *p < 0.05; ** p < 0.01; *** p < 0.001. IgG4 vs. IgG1, IgG2 or IgG3 in both (A) and (B) = p < 0.05.

