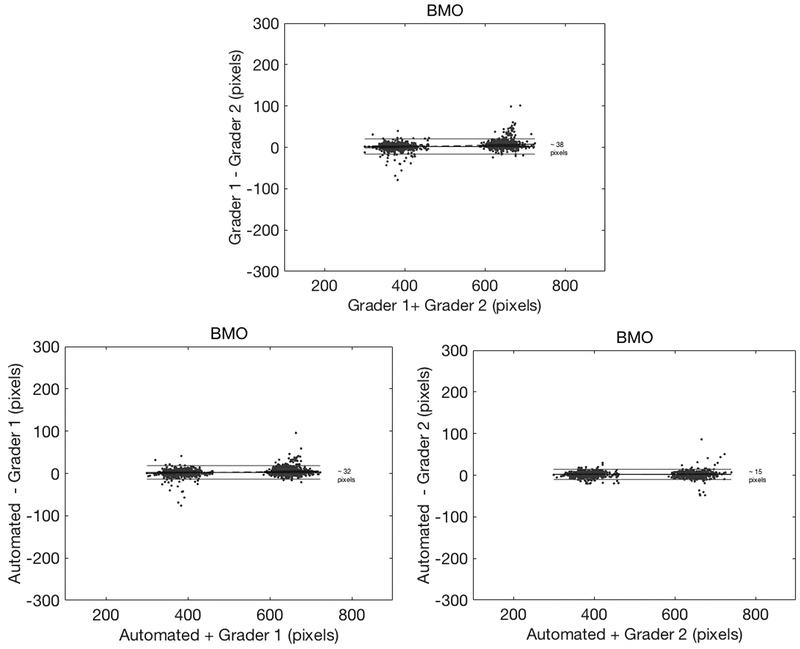
Figure 5:
Bland-Altman plots for Bruch’s membrane opening (BMO) identification, with 95% confidence interval (CI) (top) inter-grader agreement of ~38 pixels, (lower left) automated BMO detection versus grader 1 agreement of ~32 pixels, and (lower right) automated BMO detection versus grader 2 agreement of ~15 pixels. Please note that every B-scan has 2 BMO locations.

