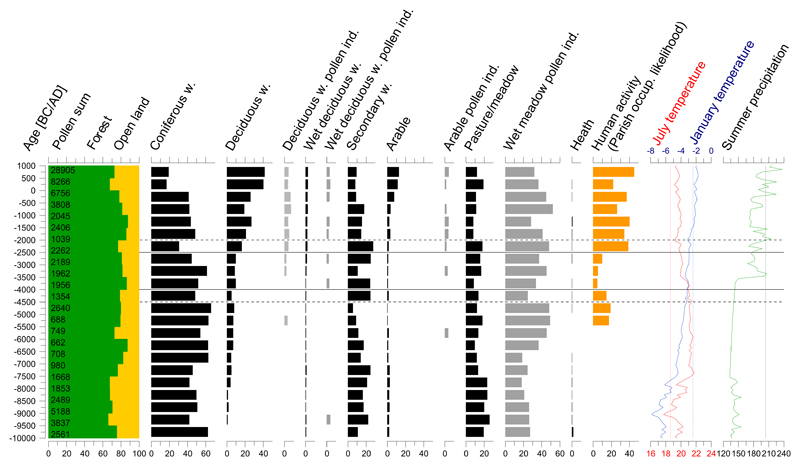
Fig. 3.
Stratigraphic diagram showing regional vegetation abundances estimated by the REVEALS model grouped into land cover classes (black bars), additional pollen proportions not included in REVEALS (grey bars), human activity model, Macrophysical climate model showing mean January and mean July temperatures and summer precipitation and evaporation. The inner solid horizontal lines delimit the time blocks with the lowest level of human activities; the outer ones delimit the time blocks with increased ratios of secondary forest taxa. The pollen sum indicates the amount of pollen counted in each 500-year time window.

