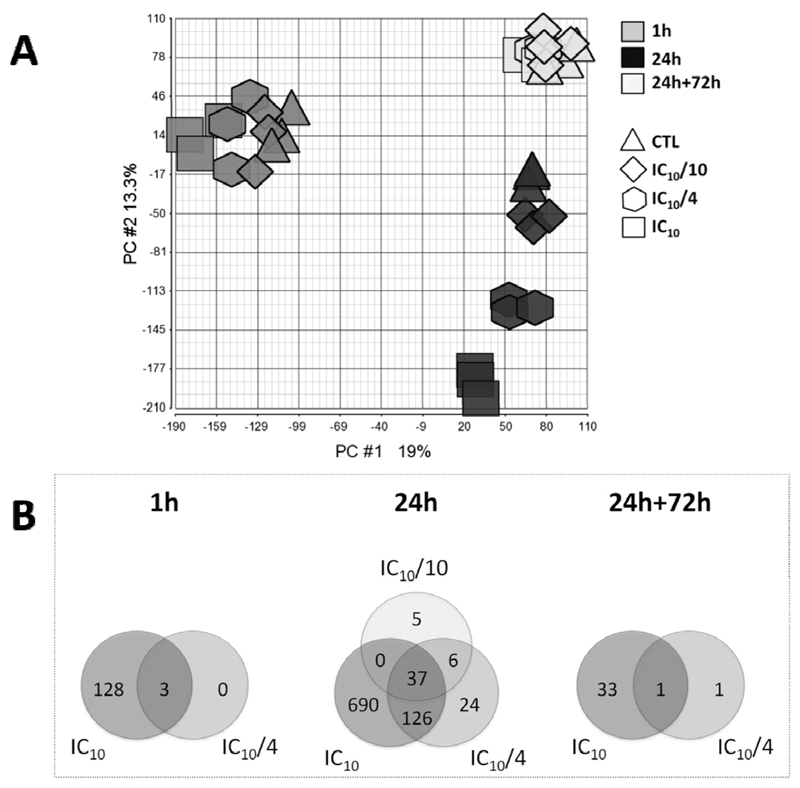
Fig. 2.
(A) Principle component analysis (PCA) plot of microarray data sets of HepaRG cells exposed for 1 h, 24 h and 24 h+72 h to 3 concentrations of bosentan, namely IC10, IC10/4 and IC10/10, and respective vehicle controls. (B) Venn diagram of modulated genes in HepaRG cells exposed to different concentrations of bosentan (IC10, IC10/4 and IC10/10) for 1 h, 24 h and 24 h+72 h (gene selection was based on a fold change modulation > 2 when compared to respective controls and Fisher’s p < 0.05).

