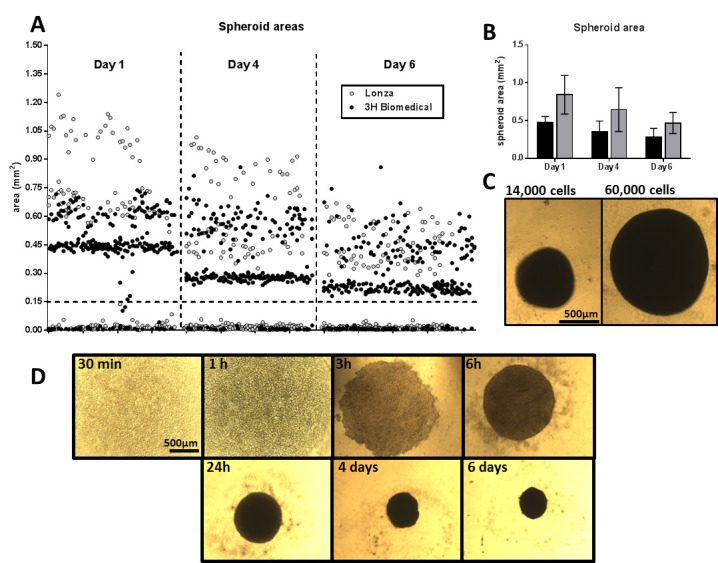
Figure 1. Formation of spheroids.

A. Area of spheroids from 2 different human donors (in white dots for the cells purchased from Lonza and black dots for the cells purchased from 3H Biomedical), at days 1, 4 and 6 after cell seeding. Notice the difference in size between donors, the progressive reduction on size and the exclusion criteria for all structures smaller than 0.15 mm2 (indicated with a dotted line). B. Average area of spheroids from the same donors at the same time points; donor from 3H Biomedical in black, donor from Lonza in grey. C. Representative images of spheroids formed with 14,000 and 60,000 cells, after 5 days. Scale bar = 500 µm. D. Time course of the formation of a spheroid (20,000 cells) up to 6 days in vitro. Notice the reduction on size. Scale bar = 500 µm.
