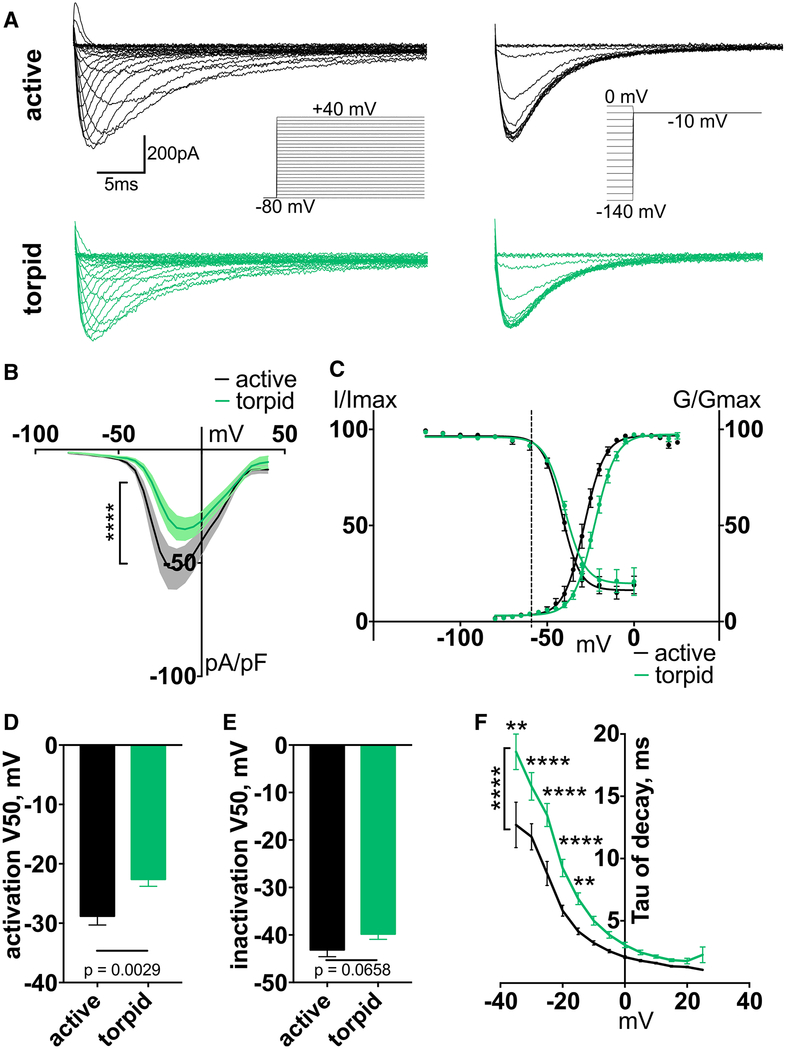
Figure 4. Nav1.8 Current Activation Is Depolarized during Torpor.
(A) Exemplar current traces and voltage protocols for activation (left) and steady-state inactivation (right) of Nav1.8 currents in DRG neurons.
(B) Current-voltage relationship of Nav1.8. Ordinary two-way ANOVA with Bonferroni correction is shown; ****p < 0.0001 main effect between species. Data are shown as mean ± SEM; n ≥ 14 cells.
(C) Activation conductance and steady-state inactivation of Nav1.8. Data are shown as mean ± SEM fit with Boltzmann functions. Dashed line indicates average RMP.
(D and E) V50 of activation (D) and steady-state inactivation (E), averaged from individual Boltzmann fits; unpaired t test (D) and Mann-Whitney U test (E). Data are shown as mean ± SEM; n ≥ 12 neurons.
(F) Inactivation rate (tau of decay), calculated from a single-exponential curve fit to the decay of the current at each voltage. Only curves fit with an R2 > 0.95 were included. Ordinary two-way ANOVA with Bonferroni correction is shown; p < 0.0001 main effect between species. **p < 0.01; ****p < 0.0001. Data are shown as mean ± SEM; n = 4–13 active; n = 2–15 torpid neurons.
See also Figure S4.

