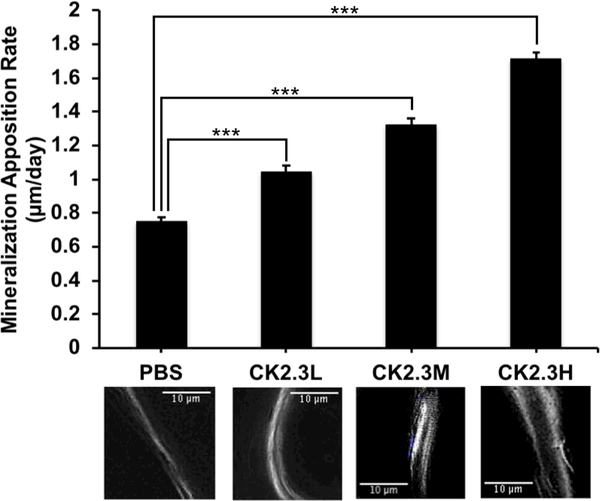
Figure 2:
Injection of CK2.3 enhanced bone growth. MAR significantly increased in CK2.3 injected mice four weeks (p-value<0.0001) after the first injection. The graph represents the average bone growth in μm per day among the different concentrations. The images underneath the graph correspond with the above concentration, were taken at 100× total magnification and represent the trabecular bone region. Six mice were used per group of treatment. Statistically significance was performed by ANOVA followed by Tukey-Kramer (***=significant, p-value<0.0001).

