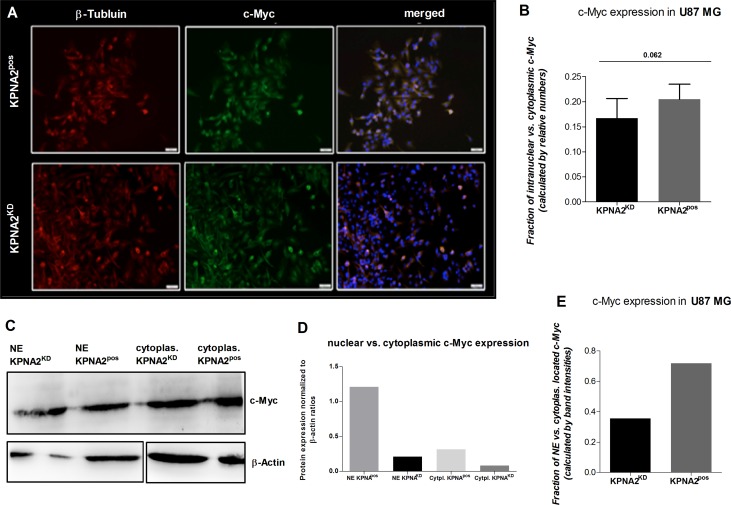
Figure 4. Silencing of KPNA2 alters the nuclear transport of the oncogene c-Myc in U87 MG cells.
(A) Immunofluorescence staining of the oncogenic transcription factor c-Myc shows expression of c-Myc in almost all cells of the U87 MG cell line regardless the treatment with or without siRNA targeting KPNA2. Co-staining with beta-Tubulin (red) for the cytoskeleton and DAPI (blue) for nuclear staining illustrates the subcellular localization of c-Myc (green). KPNA2KD cells show less nuclear localization then KPNA2pos cells. (B) Calculation of the relative distribution of nuclear/cytoplasmic c-Myc expression in KPNA2pos and KPNA2KD cells displays a strong trend towards a decreased nuclear expression of c-Myc in the KPNA2KD cells (p = 0.062). (C)Western blot analysis of the nuclear vs. cytoplasmic fractions of KPNA2KD and KPNA2pos cells shows a lower c-Myc expression in the knockdown cells in the nuclear counterpart as well as in the cytoplasm when compared to both cell compartments of the negative controls. (D) Normalization of the c-Myc protein ratios to the corresponding β-actin loading controls shows the highest expression of c-Myc in the nucleus of KPNA2pos cells, as expected. (E) Illustration of the ratio between nuclear vs. cytoplasmic c-Myc shows reduced nuclear c-Myc expression in the KPNA2KD cells.

