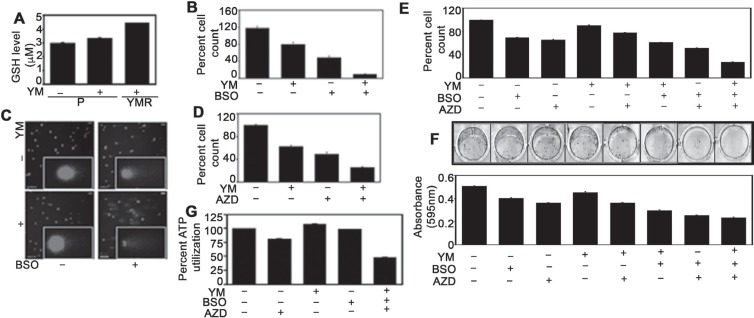
Figure 4. Inhibiting GSH levels and cell cycle check-point arrest restore YM155 sensitivity in YMR cells.
(A) Intracellular GSH measurement in P plus/minus and YMR plus 40 nM YM155 treated (for 72 h) cells. (B) Cell counting assay comparing proliferation of P and YMR cells exposed to BSO (including 1 mM pretreatment for 15 h), YM155 (40 nM) and combination of both after 72 h. YM155 versus YM155 + BSO comparison is statistically significant at p < 0.05 (0.005166). (C) Comet assay assessing DNA damage in cells exposed to treatments mentioned in (B). (D) Comparison of cell proliferation between P and YMR cells exposed to 50 nM AZD7762, 40 nM YM155 and combination of two after 72 h. YM155 versus YM155+AZD7762 comparison is statistically significant at p < 0.05 (0.010199). (E and F) Comparison of short-term and long-term proliferation by (E) cell counting and (F) colony escape assays in P and YMR cells treated with BSO (including 0.5 mM pretreatment for 15 h), YM155 (40 nM), AZD7762 (50 nM), a combination of two and a combination of three. Statistical analysis indicates that effect of YM versus BSO+YM is significant at p < 0.05 (0.0037 in (E); 0.0017 in (F)) while YM versus AZD+YM remains insignificant (0.0892) in (E) and significant (0.0125) in (F). Effects of the drugs in double combination AZD+YM or BSO+YM are also significant compared to that of the triple combination BSO+AZD+YM (0.0003 in (E) and 0.0017 in (F) for AZD+YM; 0.0003 in (E) and 0.0080 in (F) for BSO+YM, respectively). (G) Viability of P and YMR cells treated with BSO (including 0.5 mM pretreatment for 15 h), YM155 (40 nM), AZD7762 (50 nM) and a combination of three. YM155 versus YM155+BSO+AZD7762 comparison is statistically significant at p < 0.05 (2.78E-05).

