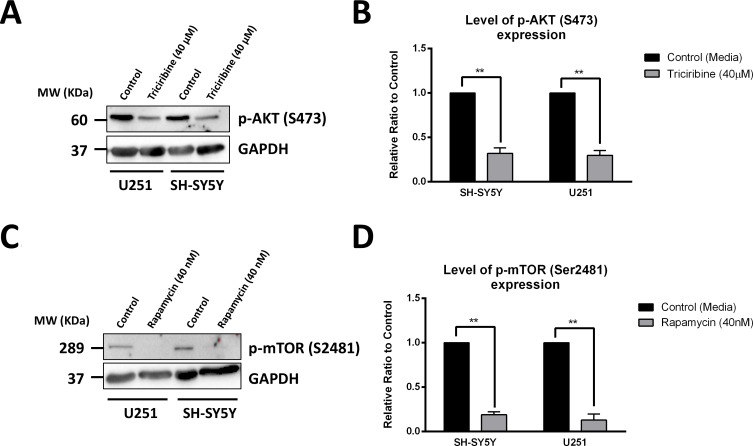
Figure 3. Rapamycin and Triciribine selectively inhibit the autophosphorylation of mTOR and Akt, respectively.
After treating SH-SY5Y and U251 cells with 40 μM Triciribine and 40 nM Rapamycin for 48 hours, proteins were extracted using RIPA buffer, and used to detect differences in expression of the phosphorylated form of AKT (S473) and mTOR (S2481), respectively. Bands were detected by enhanced chemiluminescence (ECL) using ChemiDoc MP Imaging System (A, C). Protein expression was quantified using Image Lab software, relative to the expression of GAPDH, a housekeeping gene equally expressed in treated and non-treated cells. Results are expressed as relative ratio to control (B, D). Data represent an average of three independent experiments. The data are reported as mean ± SEM (**P < 0.01; treatment compared to control, t-test).

