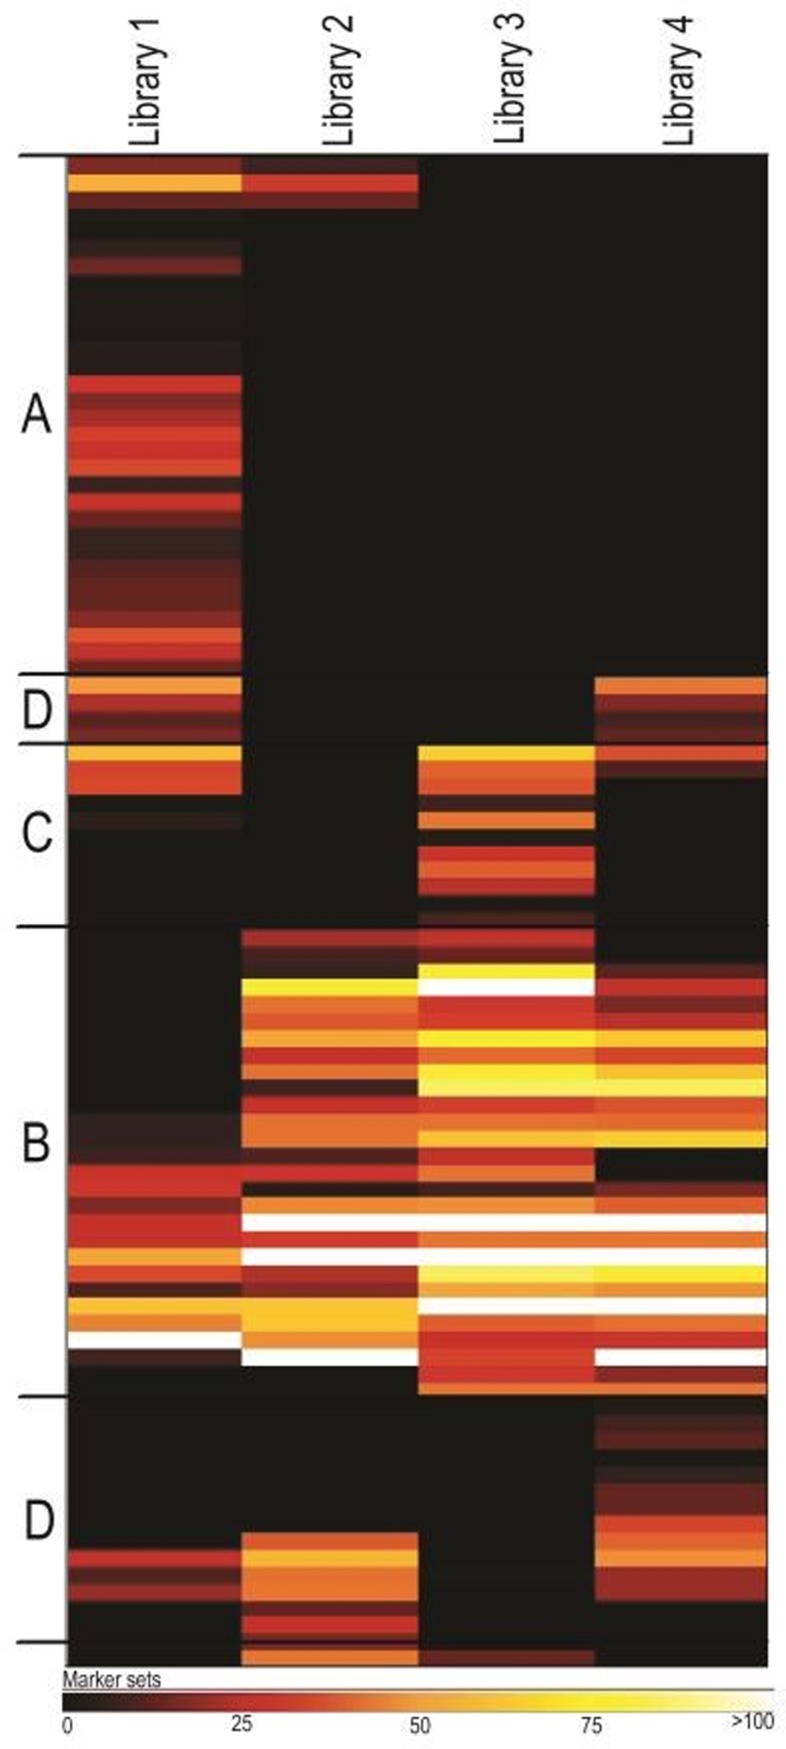
Fig 3. Heat map of clustered markers sets for bins assembled from each metagenomics library.
Letters associated with the clusters highlight major differences between libraries suggesting community dynamics during inoculation (A), stable bioreactor operation (B), and bioreactor perturbation (C and D).

