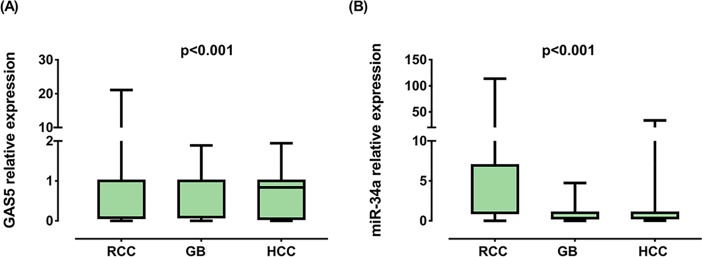
Fig 3. Relative expression of GAS5 and miR-34a-5p in cancer.
RCC renal cell carcinoma, GB glioblastoma, HCC hepatocellular carcinoma. Data are represented as medians. The box defines upper and lower quartiles (25% and 75%, respectively) and the error bars indicate upper and lower adjacent limits. Expression levels in cancer and control samples were normalized to GAPDH in RCC and HCC, TBP in GB and RNU6B for microRNA and calculated using the delta-delta CT method [= 2(-ΔΔCT)] in comparison to controls. Fold change of controls were set at 1.0. Wilcoxon matched-pair signed-rank and Mann-Whitney U tests were used for tissues of renal/brain cancer and serum of liver cancer patients, respectively. Two-sided p < 0.05 was considered statistically significant.

