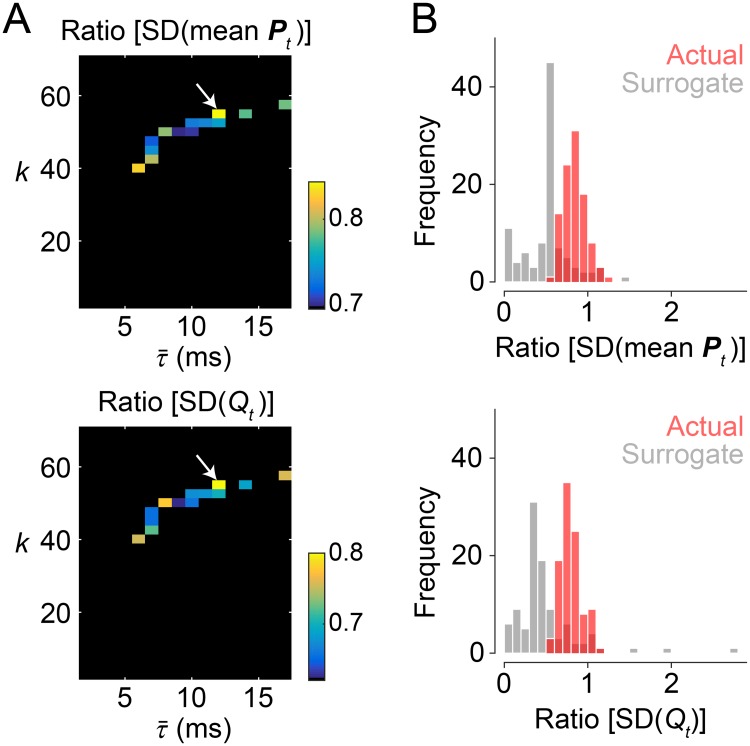
Fig 3. Model parameter search in the second stage.
(A) The ratio of the SDs of mean participation coefficient (top) and modularity (bottom) of modeled time-resolved functional connectivity to those of the empirical ones. These ratios were evaluated at the parameter sets extracted in the first stage and their averages over the 100 simulation samples are presented in the heat maps. From the parameter set , pointed by a white arrow, we obtained the SDs of mean participation coefficient and modularity that were on average closest to those observed in the empirical data. This parameter set was selected for further comparison of the modeled and empirical data. (B) Distributions of the ratio of modeled to empirical fluctuations in mean participation coefficient (top) and modularity (bottom). The distributions obtained from simulations with the actual structural connectivity data are shown in light red and the distributions from the surrogate data are shown in light gray.

