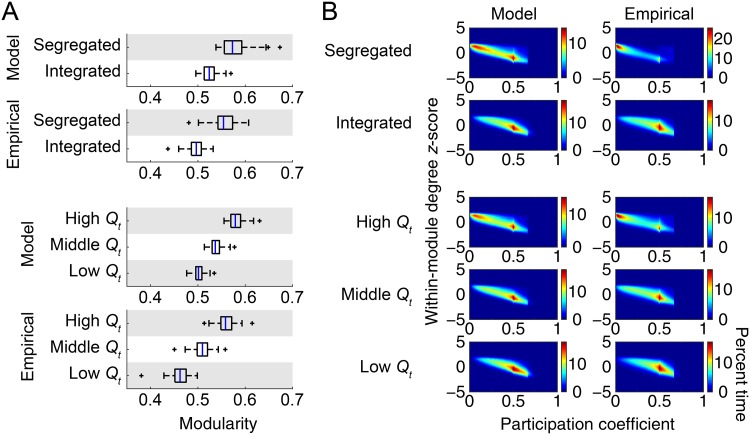
Fig 4. Network metrics averaged for each network state.
(A) Modularity Qt averaged for each network state within each individual sample (model) or subject (empirical). (B) Joint histograms of within-module degree z-score zt and participation coefficient Pt over all nodes averaged for each network state. The percent time is derived from joint histograms of all samples (model) or subjects (empirical).

