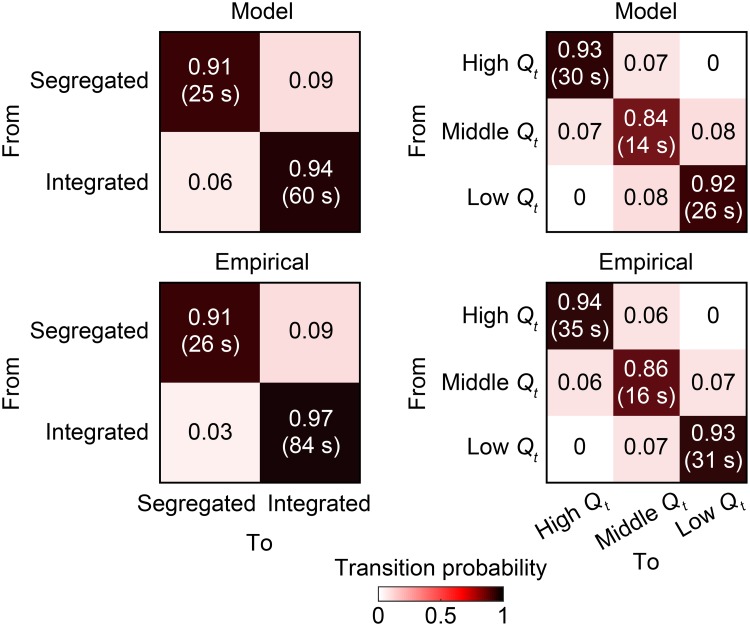
Fig 5. Temporal metrics of network states.
The transition probability of each pair of network states is shown in the corresponding entry of matrices. The mean dwell time of each network state is presented in a parenthesis in the corresponding diagonal entry. Both temporal metrics are averaged over samples (model) or subjects (empirical).

