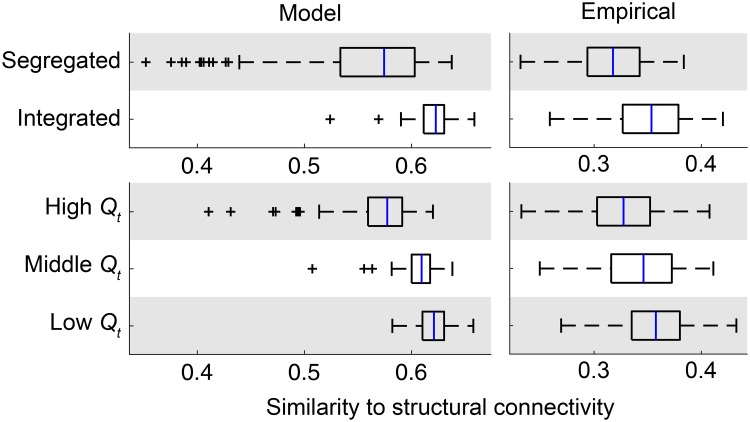
Fig 7. Spatial patterns of functional connectivity with respect to its similarity to structural connectivity.
The similarity between group-level structural connectivity and the centroid of time-resolved functional connectivity during each network state in each sample (model) or subject (empirical) was presented for the segregated and integrated states (top) and the high, middle, and low modularity periods (bottom). The similarity for modeled functional connectivity is shown in the left side and the similarity for empirical functional connectivity is shown in the right side.

