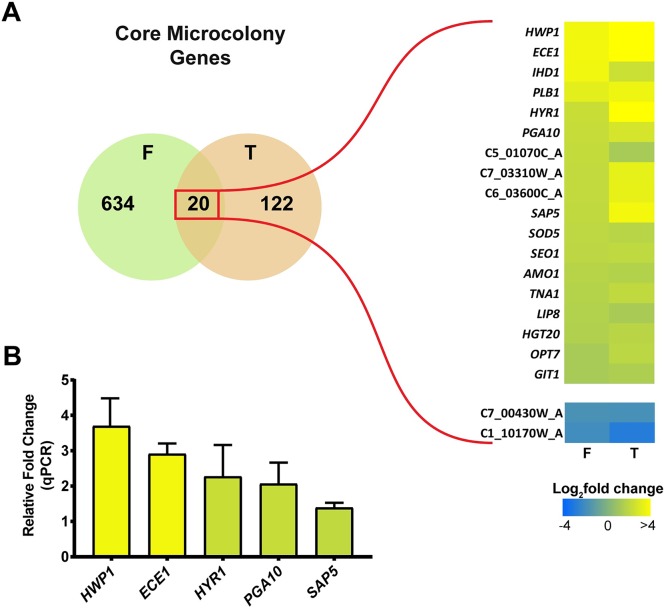
Fig 3. Twenty common genes are differentially regulated in microcolonies formed by both flow and temperature.
(A) RNA-seq was performed on CAI4 biofilms grown under microcolony inducing conditions (37°C with flow) and compared to non-microcolony biofilms grown at 37°C without flow (F) or at 23°C with flow (T). Numbers in the Venn diagram indicate differentially regulated genes from each dataset with the genes in the overlap region also sharing the direction of regulation (increased or decreased in both datasets). A heatmap of the expression data of the 20 core microcolony genes is shown on the right. (B) Expression of the core microcolony genes HWP1, ECE1, HYR1, PGA10 and SAP5 was quantified by qRT-PCR on CAI4 microcolonies grown under flow and 37°C, and compared to CAI4 non-microcolony biofilms grown at 37°C without flow. Expression data was first normalized to control actin prior to comparison between samples. The results represent the averages from triplicate samples from two independent experiments. The error bars indicate standard deviations.

