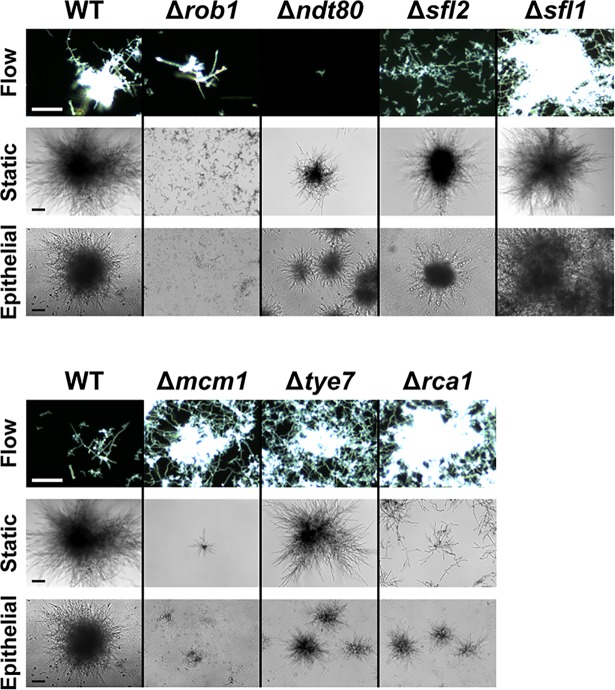
Fig 5. Candida albicans transcriptional regulator knockouts Δrob1, Δndt80, and Δsfl1 showed microcolony formation defects.
Candida albicans wild-type (WT) cells and seven transcriptional regulator knockouts were evaluated for their microcolony formation using flow assay, and static plate assays (RPMI and 5% CO2) on both plastic and epithelium. Flow microcolonies were imaged using time-lapse microscopy. Flow sample images show results at 18 h (WT [top], Δrob1, Δndt80, and Δsfl1), 8 h (WT [bottom], Δmcm1, Δtye7, and Δrca1), and 24 h (Δsfl2). Static microcolonies were grown for 24 h prior to imaging. Microcolonies that showed consistent differences in both static and flow conditions when compared to WT are on the top row, with most showing reduced microcolony formation (except Δsfl1 that had larger microcolonies). The three remaining mutants (bottom row) had inconsistent results between static and flow conditions, with flow microcolonies being more dense and static microcolonies being reduced in size. Scale bars indicate 100 μm.

