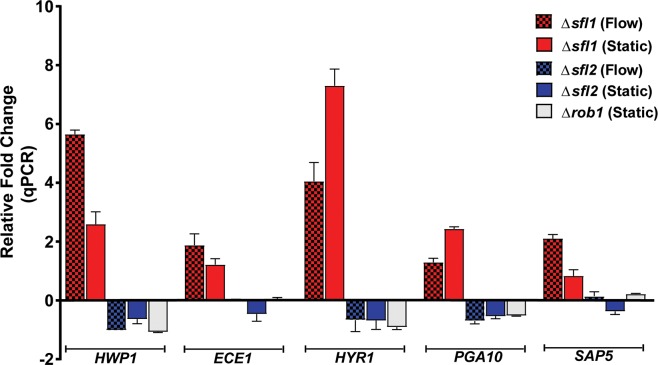
Fig 6. Quantitative real-time RT-PCR analysis of core microcolony genes under flow and static conditions.
Expression of the core microcolony genes HWP1, ECE1, HYR1, PGA10 and SAP5 was quantified by qRT-PCR experiments in Δsfl1, Δsfl2 and Δrob1 strains grown under flow and static conditions at 37°C. Expression of the core microcolony genes were highly up-regulated in Δsfl1 cells (flow indicated by red hatched bars, static by red solid bars), and down-regulated in both Δsfl2 (flow indicated by blue hatched bars, static by blue solid bars) and Δrob1 (static white bars) microcolonies. Bars in each graph indicate relative fold changes in RNA expression of each sample as compared to control actin. The results represent the averages from triplicate samples from two independent experiments. The error bars indicate standard deviations.

