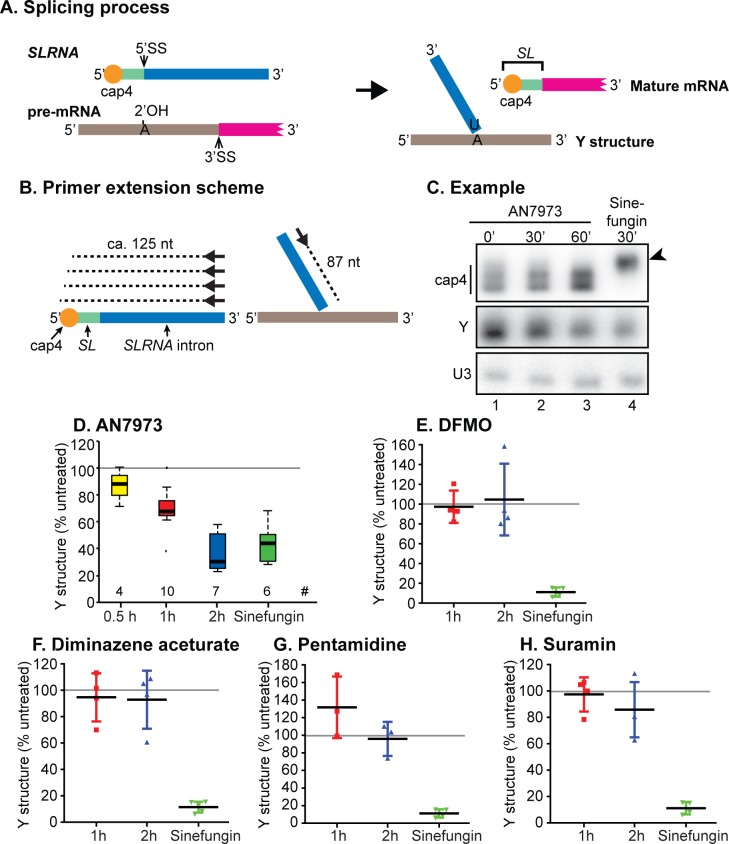
Fig 4. Effect of AN7973 on trans-splicing.
A) Schematic representation of the splicing reaction. SLRNA and Y structure during primer extension experiments. SLRNA is represented with various colours; red is the cap4 region, green is the spliced leader (SL), blue is the SL intron. The pre-mRNA is shown with a grey intergenic region and a magenta portion that represents the 5' end of a mature mRNA. The 5' and 3' ends of each RNA are indicated. During trans splicing, the SL intron forms a branched "Y" structure with the 2' hydroxyl of an adenosine located 5' to the polypyrimidine tract that is recognised by the splicing machinery. Meanwhile the SL is trans spliced to the 5'-end of the mRNA. B) Schematic representation of the primer extension assay. The 5'-end labelled oligonucleotide primer hybridises towards the 3' end of the SLRNA. Reverse transcription on the intact SLRNA extends (dashed line) towards the 5' end but terminates upon encountering the methylated residues of cap4. In the Y structure, the primer extends (dashed line) until the branch point, giving an 87nt product. C) Typical result from a primer extension experiment illustrated in (B). A primer complementary to the U3 snRNA was used as a control. Lane 1 (0’) shows the result from trypanosomes that were treated with DMSO only. Lanes 2 and 3 show the results from trypanosomes treated with AN7973 for 30 min and 60 min, and lane 4 is the result for 30 min Sinefungin. The arrowhead shows the primer extension product from unmethylated SLRNA. D) Quantification from several independent tests of AN7973 treatment; the ratio between Y structure and the U3 signal is shown. # indicates the number of data points used. Sinefungin results were taken only from experiments that included AN7973 on the same gel. The central line is the median, and boxes extend from the 25th to the 75th quartile. The whiskers extend to the most extreme data point that is no more than 1.5 times the inter-quartile range. Other points are outliers. Details for our initial experiments are in S1A and S1B Fig. After only 30 min incubation with AN7973, the difference between treated and untreated cells was significant using a one-way ANOVA. E-H) Trypanosomes were incubated with 10x EC50 of various known anti-trypanosomal drugs for 1h or 2h, then splicing was assayed. The % Y structure (relative to U3) is shown (individual points, plus mean and standard deviation). The 95% confidence intervals are shown in S1C–S1F Fig.

