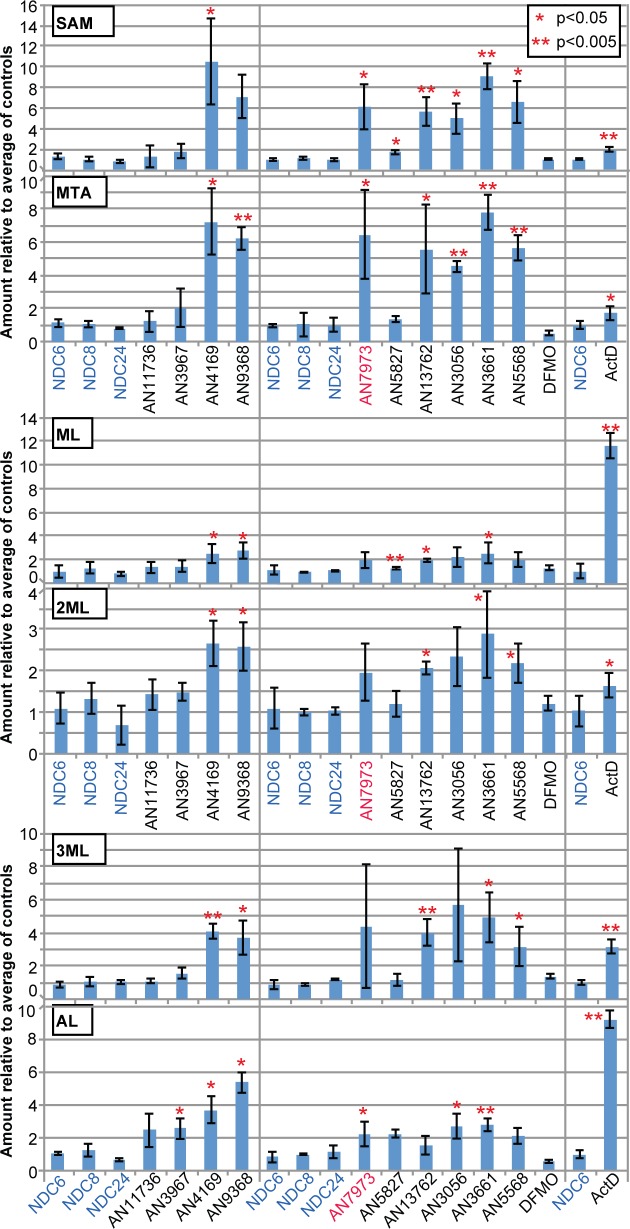
Fig 5. Effects of benzoxaboroles on the metabolome.
Fold increases are shown for selected metabolites, relative to untreated cells (mean and standard deviation). The numerical data are in S6 Table. SAM: S-adenosylmethionine; MTA: methylthioadenosine; ML: methyllysine; 2ML: dimethyllysine; 3ML: trimethyllysine; AL: acetyllysine.

