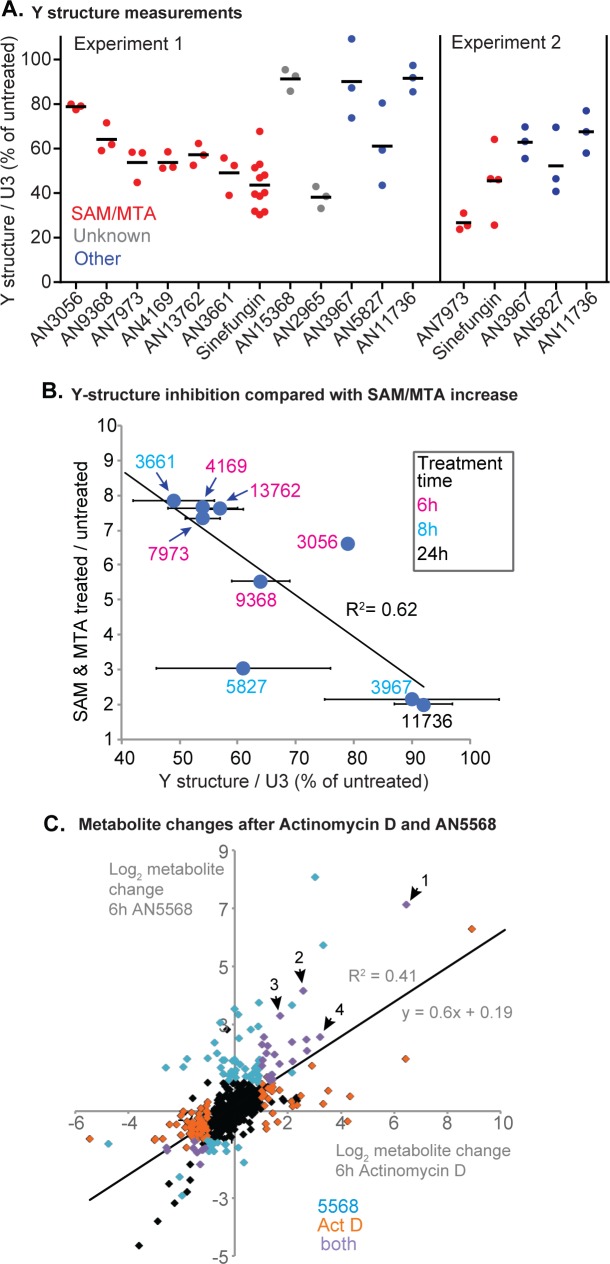
Fig 7. Relationship between trans splicing inhibition and methylation changes.
A) Trypanosomes were incubated with 10x EC50 of various compounds for 2h, then splicing was assayed as in Fig 4. The % Y structure (relative to the U3 control) is shown. Results are shown for one experiment (experiment 1) with a full compound set and for a second experiment with selected compounds. A time course for the second experiment is shown in S4A Fig. B) The mean increase in SAM and MTA after treatment with each compound is plotted on the y-axis; the x-axis shows mean and standard deviation of the % Y-structure remaining (data for experiment 1 in (A)). The AN numbers are colour-coded to indicate the time of incubation prior to metabolome analysis. C. Metabolite changes after AN5568 or Act D treatment (both 5h). Each point represents a metabolite; data are in S7 Table. Orange: significantly affected by Actinomycin D; cyan: significantly affected by AN5568; purple: significantly affected by both treatments. Labelled metabolites are: 1- Glutathione disulfide; 2- Lys-Val-Pro; 3- N6,N6,N6-Trimethyl-L-lysine; 4- N6-Acetyl-L-lysine.

