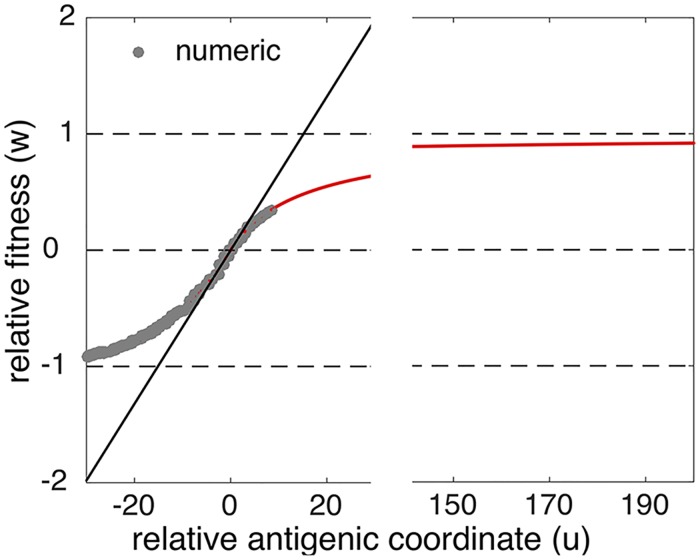
Fig 2. Traveling fitness landscape and its linear approximation near the infected peak.
Red curve: analytic result (Eq 7). Gray circles: Monte-Carlo simulation based on Eq 1. Black line: linear approximation with the average selection coefficient σ = 0.066 (Eq 8). Parameters as in Fig 1: R0 = 2, a = 9, Ub = 5.8 × 10⁻⁶, N = 108. For the accuracy of linear approximation, see S1 Fig.

