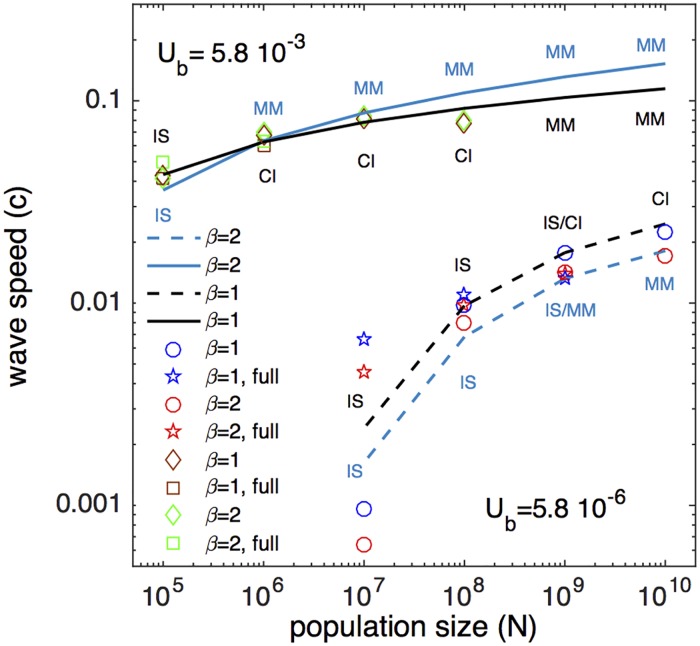
Fig 3. Analytic results for the evolution speed are confirmed by stochastic simulation.
Simulation is performed at fixed parameters R0 = 2, a = 9; Ub and β as shown. Solid and dashed lines are analytic results for the wave speed, c (Eq 6, S14, S16-S18) at two values of mutation rate Ub which define the broadest range of interest for RNA viruses, and two values of parameter β to test sensitivity to the density of selection coefficient distribution. Symbols show results either performed by full stochastic simulation of the SIR model (Eq 1) or by a reduced simulation with σ = 0.066 (S1 Appendix).

