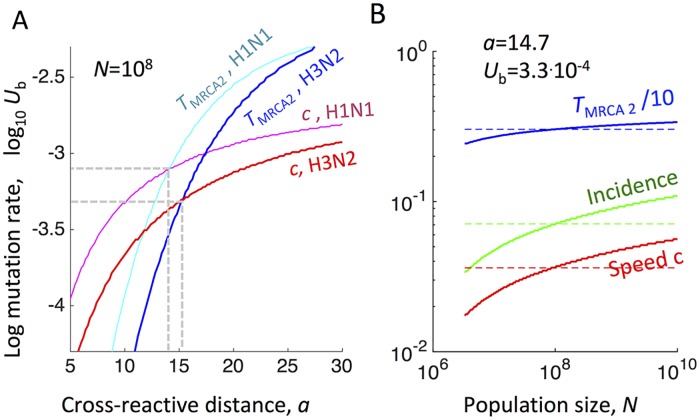
Fig 4. For influenza A virus, the model predicts annual incidence and cross-immunity which agree with observations.
Shown is the best-fit to combined immunological, epidemiological, and evolutionary data available on influenza A strains H3N2 (red and blue colors) and H1N1 (magenta and cyan colors). (A) X and Y-axis are the cross-immunity scale, a, and the mutation rate per genome per transmission event, Ub, respectively. Analytic predictions for the evolution speed c (red and magenta curve, Eq 13) and TMRCA2 (blue and cyan, Eq 15 with z = 3) are shown as contours of constant heights taken from data [7] (Extended Data Table 1 and refs). Population size is estimated N ∼ 108 [31]. Dashed lines show the intersection points where both parameters fit experimental values. (B) Solid curves: The same three quantities for H3N2 as a function of population number N at the best-fit values of a and Ub. Dashed lines correspond to N = 108. (A and B) Input from data [7, 31]: R0 = 1.8, c = 2.6 AA/year, TMRCA2 = 3.0 years for H3N2 and R0 = 1.46, c = 2.3 AA/year, TMRCA2 = 4.6 years for H1N1. Infection cycle time trec = 5 days. Predicted annual incidence of infection of (4 − 7)% and the cross-immunity scale a = (14 − 15) AA are in good agreement with independent data [37].

