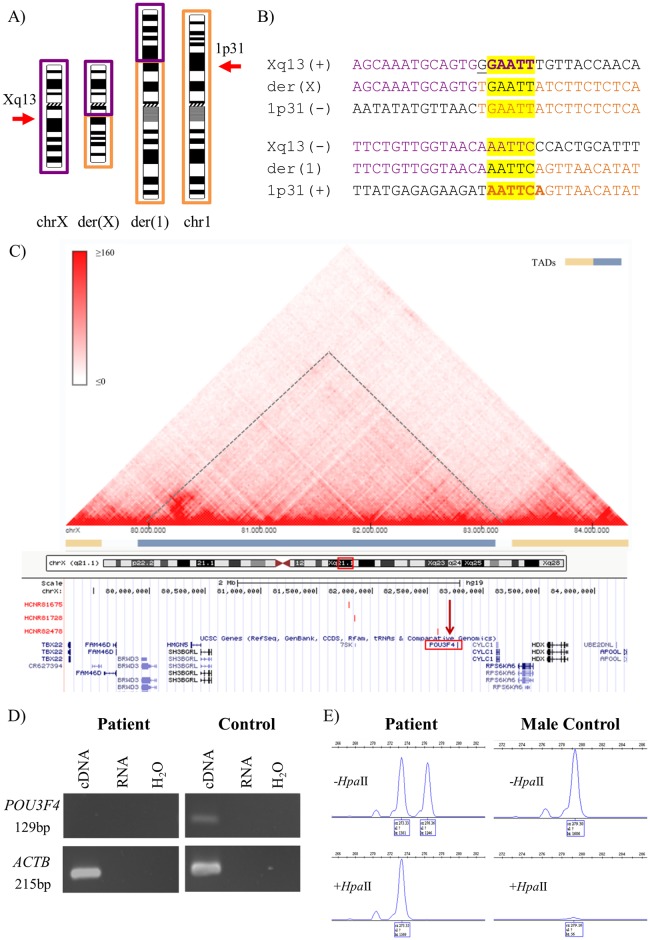
Fig 1. Summarized karyotype, WG-MPS, Sanger sequencing, RT-PCR and X-inactivation results from Case 1.
A) Partial ideograms showing the normal and derivative (der) chromosomes (chr) X (purple) and 1 (orange) (not to scale) in Case 1. Xq13 and 1p31 breakpoints are indicated by arrows. B) Derivative translocation junction sequences (middle line) and matching reference sequences (top and bottom lines) as identified by Sanger sequencing. Microhomology is highlighted in yellow, deleted sequences are underlined, and duplicated sequences are in bold letters. C) Schematic illustration of the Topologically Associated Domain (TAD) structure at the POU3F4 locus (indicated with a dashed line and a blue bar) as created by the 3D Genome Browser (http://promoter.bx.psu.edu/hi-c/). Each dot within individual TADs reflects the interaction between two DNA positions. The corresponding region from the UCSC Genome Browser was aligned underneath the heat map. This illustrates among other genes POU3F4 (red rectangle), the der(X) breakpoint identified in the current study mapping ~87kb upstream POU3F4 (vertical red arrow), as well as specific enhancers identified by Naranjo et al., 2010 upstream POU3F4 (red vertical bars). D) RT-PCR results showing absence of POU3F4 expression in the patient as compared with a normal control. cDNA = RNA reverse transcribed; RNA = RNA not reverse transcribed; H2O = no template sample. E) X-inactivation analysis results showing a skewed X-inactivation pattern (100:0). A PCR product is obtained only from the inactive (methylated) chromosomes. After HpaII digestion, only one peak was shown in the female patient, whereas, no peak was observed in the male control.

